
Why teams choose Sigma vs Excel
We excel in the cloud
Work with data in the spreadsheet format—and functions—you already know.
Dashboards that work the way you’ve always wanted
Don’t choose between speed-to-insight and scalability. Sigma dashboards get you both.
Build powerful apps on your cloud data
Know how to use a spreadsheet? Now you can build a data application.
Scale with unmatched performance
Generate sustainable revenue by using Embedded Applications with Sigma to sell data as a product to your existing customers.
Enterprise SDLC
Get production-grade controls without the engineering overhead. Sigma isolates draft and live states using connection-aware deployment and version tagging.
AI Ecosystem
Sigma is your OS for live data and AI. Securely unify external agents via MCP with warehouse LLMs and Sigma Agents for natural language discovery and action without vendor lock-in.
AI, Apps, and Agents with all the BI that you expect.
We excel in the cloud
Analyze billions of rows of live warehouse data using spreadsheet formulas you already know. No stale extracts, row limits, or proprietary coding languages. Ask Sigma Assistant if you have a question.
Dashboards built the way you’ve always wanted
Use Sigma Assistant to help you build dynamic, interactive dashboards without writing SQL or waiting on data engineering. Drill down to the underlying row level instantly on live, governed data.
Write directly back to your warehouse
If you know how to use a spreadsheet, you can safely capture data, run live scenarios, and trigger downstream workflows. Deploy Sigma Agents to fully automate those actions with a complete audit trail.
Scale with unmatched performance
Securely embed live analytics and writeback capabilities into your customer portals. Automatically inherit warehouse security for strict multi-tenant data isolation without duplicate permission models.
Sigma is enterprise BI with a spreadsheet UI.
FEATURE COMPARISON
As of May 16, 2025
Sigma
Excel
Data Scale
Built for cloud-scale data. Query billions of rows directly in the warehouse without crashing.
Limited by local memory and file size. Slows down or breaks with large datasets.
Real Time Data Sources
Live connection to cloud data warehouses.
Requires manual data refresh or scripts; not built for real-time data.
Version Control
Built-in version control for every workbook and dashboard.
Limited or manual version tracking. Often managed by duplicating files or using external tools.
Data Lineage
Full lineage tracking from source to cell. See exactly where data came from and how it was transformed.
No native lineage. Dependencies are invisible and easy to break.
Workflows
Build Data Apps with interactivity, writeback, and UI elements like forms and modals. Automate workflows on live data.
Teams build ad hoc workflows that result in spreadsheet sprawl, data duplication, and version confusion.
Tabular Interface
Familiar spreadsheet layout with rows, columns, and formulas — powered by live warehouse data.
Native tabular/spreadsheet format that users know.
Query Performance
Queries are optimized by the warehouse and Sigma’s proprietary intelligent engine.
Not a query engine. Large datasets require manual optimization or cause lag.
Pivot Table
Drag-and-drop pivot tables with dynamic grouping, filtering, and formatting on live data.
Robust pivot functionality, though limited to static or local data.
Live Editing
Real-time collaboration like Excel. Multiple users can edit and comment simultaneously.
Easy real-time collaboration. Multiple users can edit and comment simultaneously.
Write Back
Input data directly into governed tables in your cloud warehouse using a spreadsheet UI.
Original spreadsheet UI. Breaks at large data volumes and can’t scale, govern, or sync inputs to real time sources reliably.
Dashboards
Build rich, interactive dashboards on live data using a spreadsheet UI.
Classic visualization options. Not designed for B+ row data sets.
Drill Down
Right-click to drill into row-level data as easily as excel. No setup required.
Manual filtering or separate sheets needed to replicate drilldowns.
AI
AI built into your live data workflows. Use natural language to query data, generate formulas, and enrich analysis.
Can’t query company wide data. Limited scale, governance, and connectivity for enterprise AI use cases.
Trusted by 2,000+ leading enterprises around the world
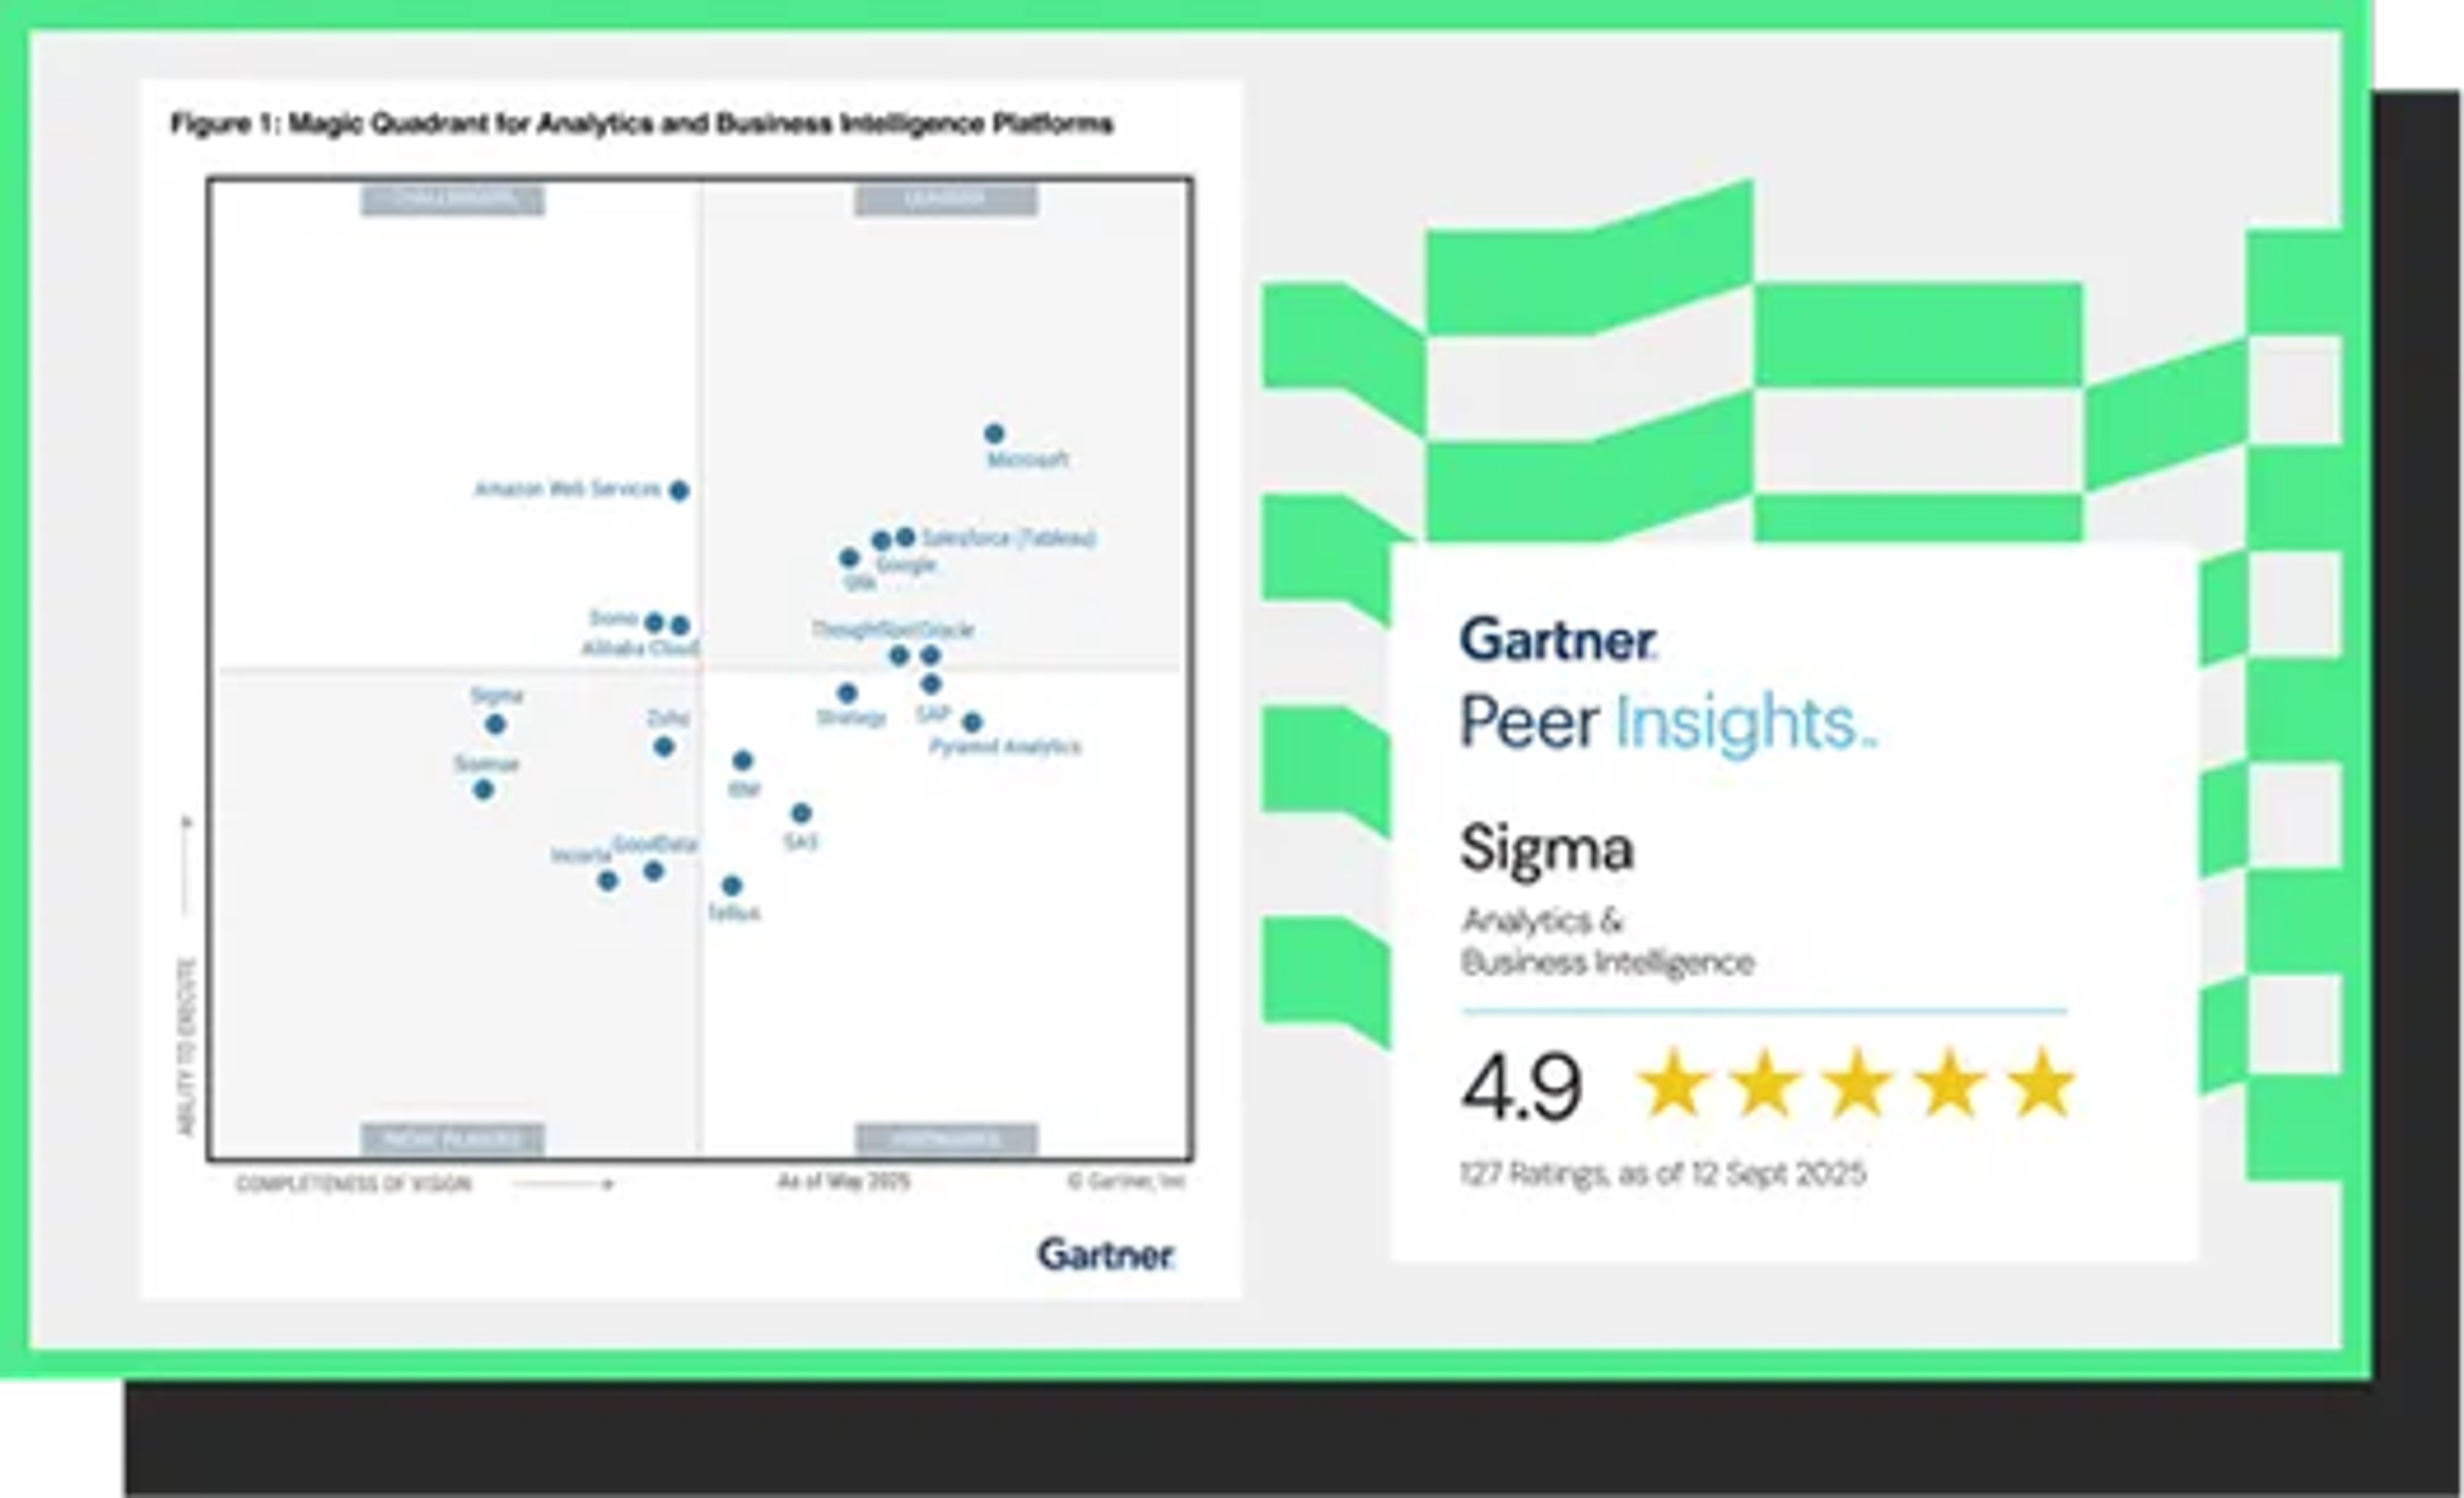
The 2025 Gartner® Magic Quadrant™ for Analytics & Business Intelligence
Read about Sigma's first-time recognition in this report.
Don't take it from us, take it from our customers

“The best and possibly last BI tool you will ever need”
Darlina J.
Business Intelligence Manager Enterprise
Top teams choose Sigma.
See for yourself. Sigma is a G1 crowd favourite, backed by countless reviews.

Additional resources

Excel vs. Sigma: When To Stick With Spreadsheets And When To Upgrade
Excel has long been a go-to tool for data analysis, but when should you upgrade? This guide compares Excel vs. Sigma, highlighting key features.

5 Disadvantages of Excel for Data Visualization
Struggling with Excel for complex data analysis? Uncover 5 key limitations and see how cloud analytics can transform your decision-making and your business.

How Talroo ditched a risky Excel-based process with instant access to Sigma
Talent attraction platform Talroo left Excel behind and gave business users direct access to data with Sigma.
Ready to see the difference?
Join thousands of data teams who have transformed how they work with Sigma.