Workflow Recap: Accelerate the Close Process with AI-Assisted Variance Commentary
Most of the conversation around finance transformation still focuses on tools. But in practice, the challenge isn’t the tools themselves, it’s the workflow around how financial data is modeled, explained, and acted on.
At Workflow 2026, Sigma’s first user conference, I focused on a problem I’ve seen consistently across large organizations: the P&L process breaks down after the numbers are produced. The real work—understanding what changed and why—still happens outside the system in fragmented, manual workflows.
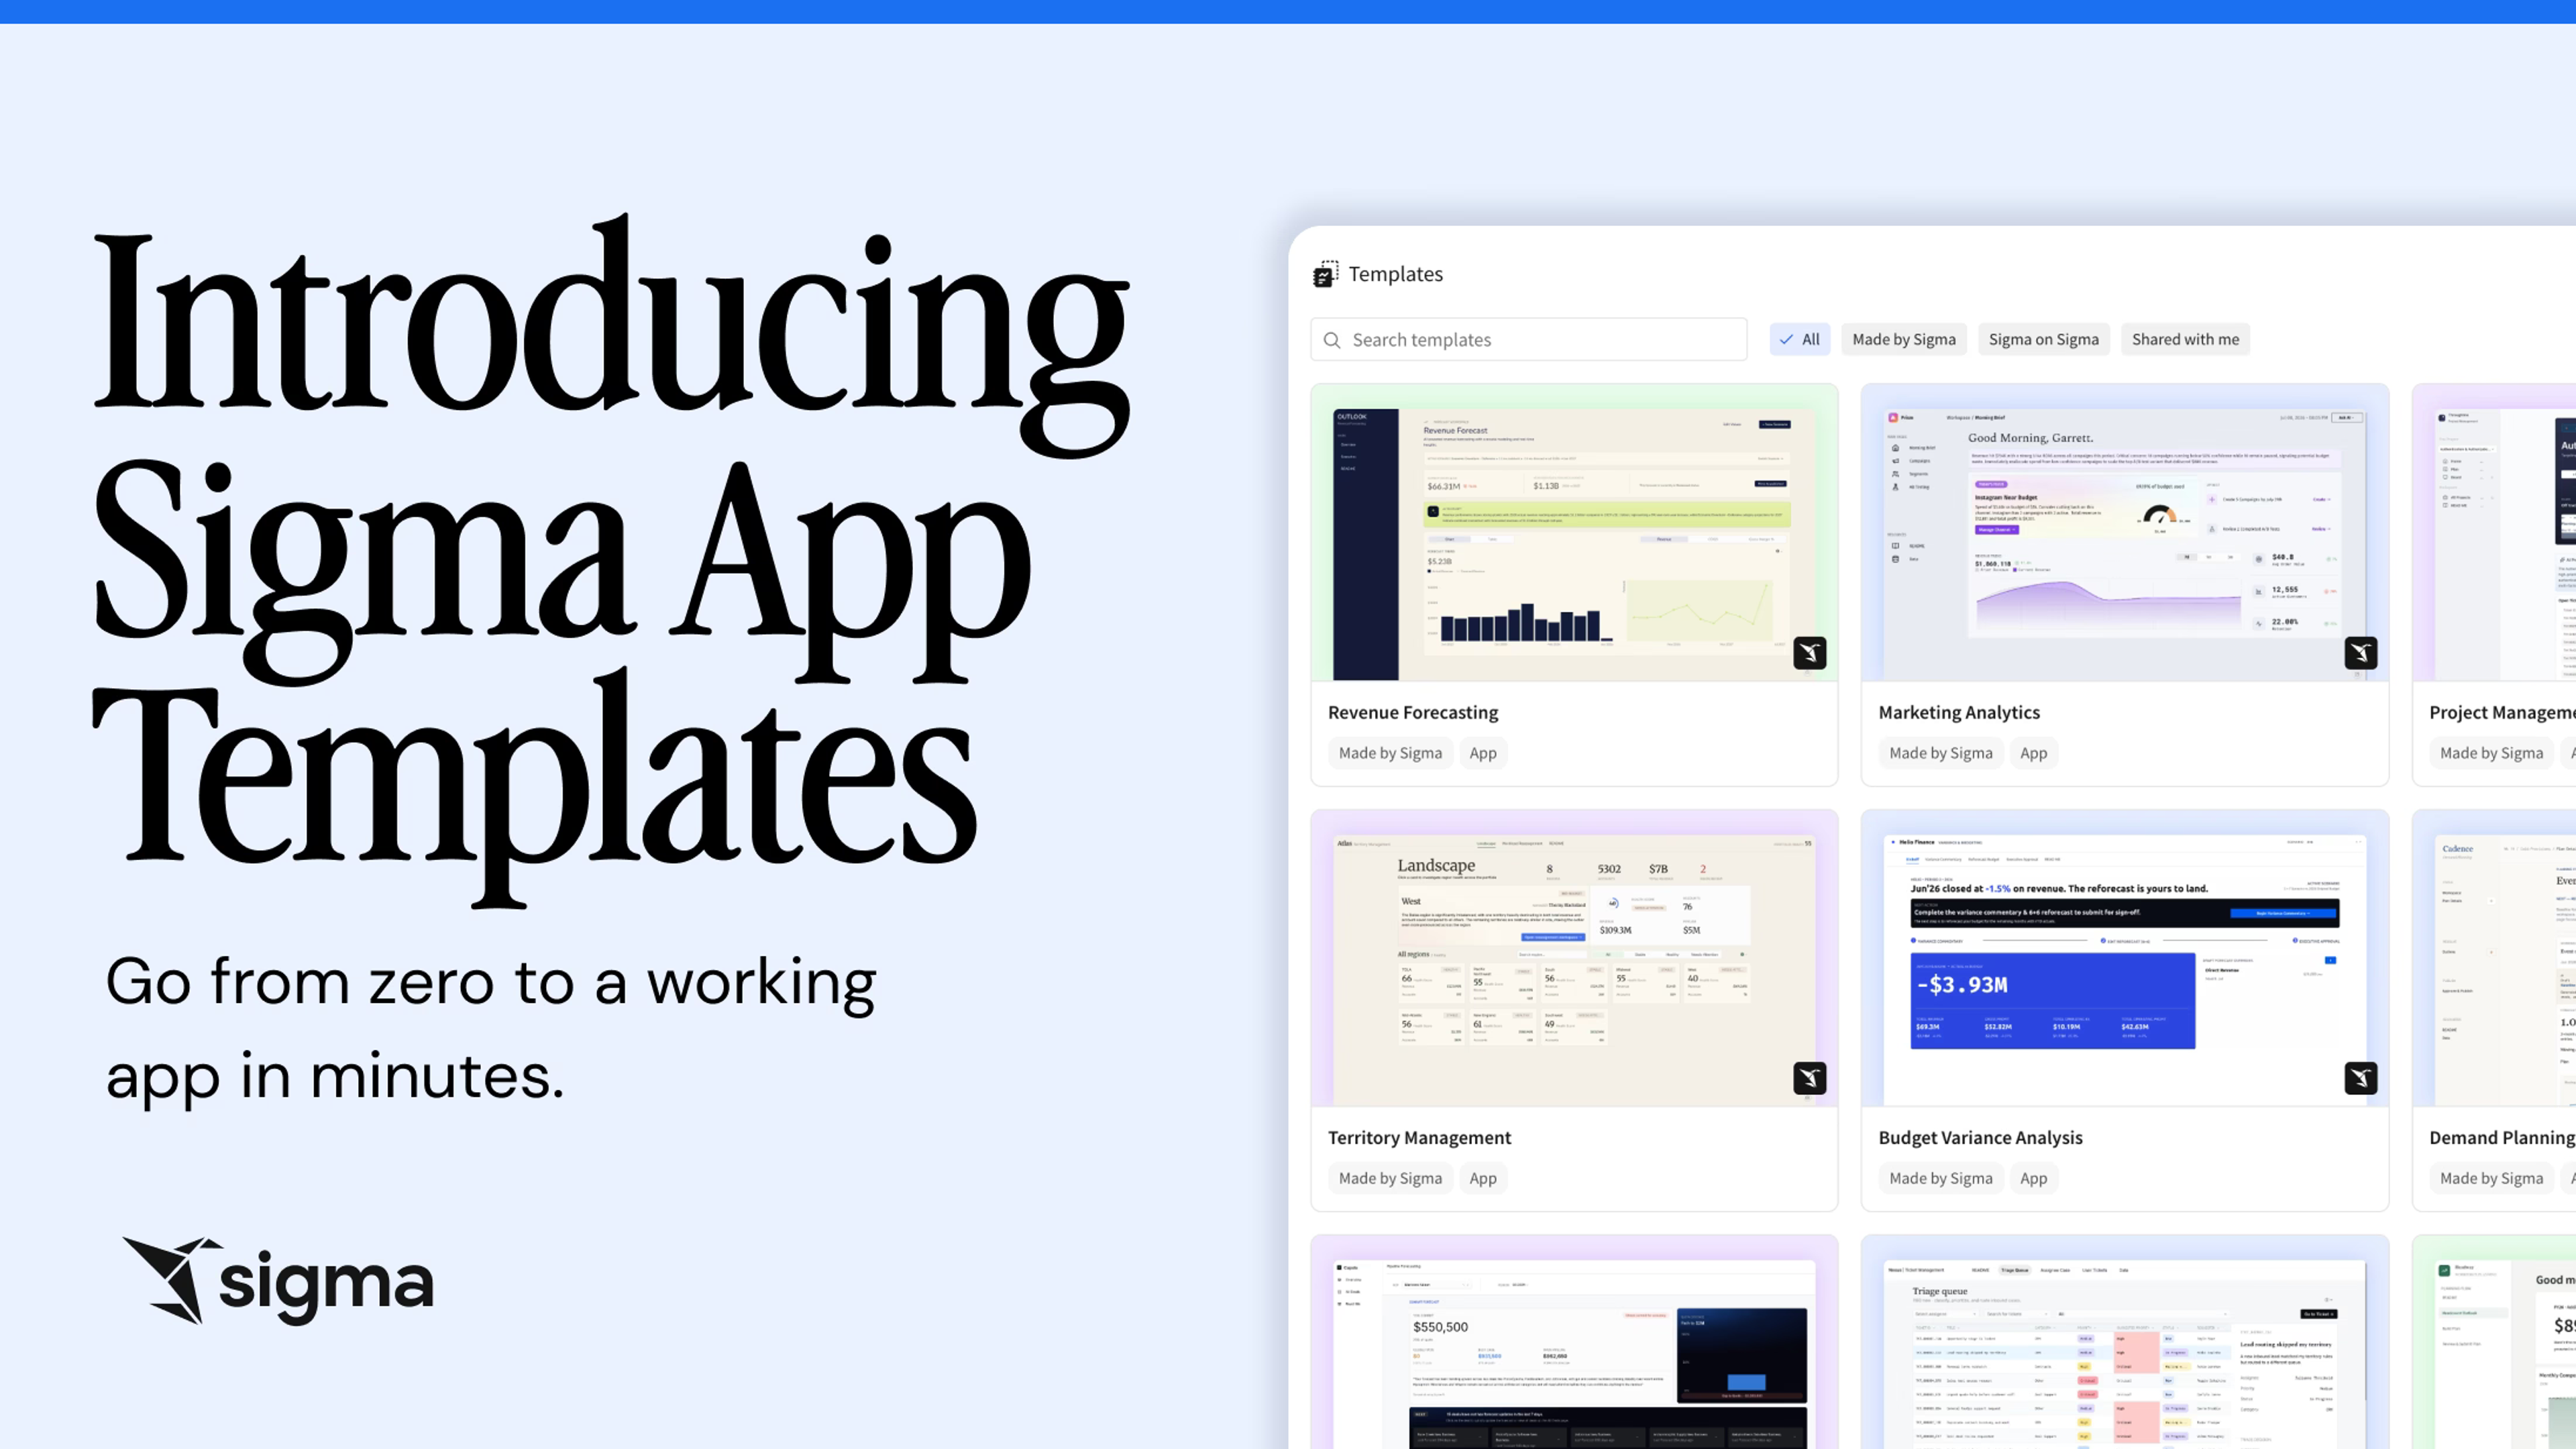
In this session, “Building an AI Application for Finance,” I walked through how we can rethink that process by turning the P&L into an application inside Sigma, combining financial modeling, commentary, and AI-driven analysis in a single governed system.

Time to stop explaining variance in spreadsheets
Before you can fix the problem, you need to understand what it is first. In most organizations, producing the P&L is not the hard part. You can generate it from an ERP or a planning tool without much friction. The real work begins after it’s exported. Analysts go line by line and start adding context at a granular level. What happened in the supply chain? What happened in sales? Why did labor move? Each account or department ends up with its own explanation, typically captured in a spreadsheet that lives outside the system that produced the numbers.
At one site, that might feel manageable. But imagine a business operating across dozens or even hundreds of locations. Now you have that same commentary process repeating itself across the organization every month, each version slightly different, each file moving on its own timeline. But that isn’t useful—what you really need is something coherent company-wide that enables someone like the CFO to understand the handful of drivers that actually moved the business, and still be able to trace them back to the source if needed.
But when the commentary is fragmented across disconnected files like this, that synthesis becomes slow and harder to trust at scale. That’s the real problem at the heart of P&L.
The solution: turn your P&L into an application
Once you’ve identified the problem, the next step is to rethink what the P&L actually is. In most environments, it’s treated as an output. You generate it, export it, and then begin explaining it somewhere else. But that might not be the best approach. Traditional BI tools fall short in this sense because they solve a different problem. They let you drill into totals, but they don’t let you construct a true financial statement with calculated lines, structured subtotals, and embedded commentary. Planning tools can approximate it, but they require significant setup and ongoing overhead.
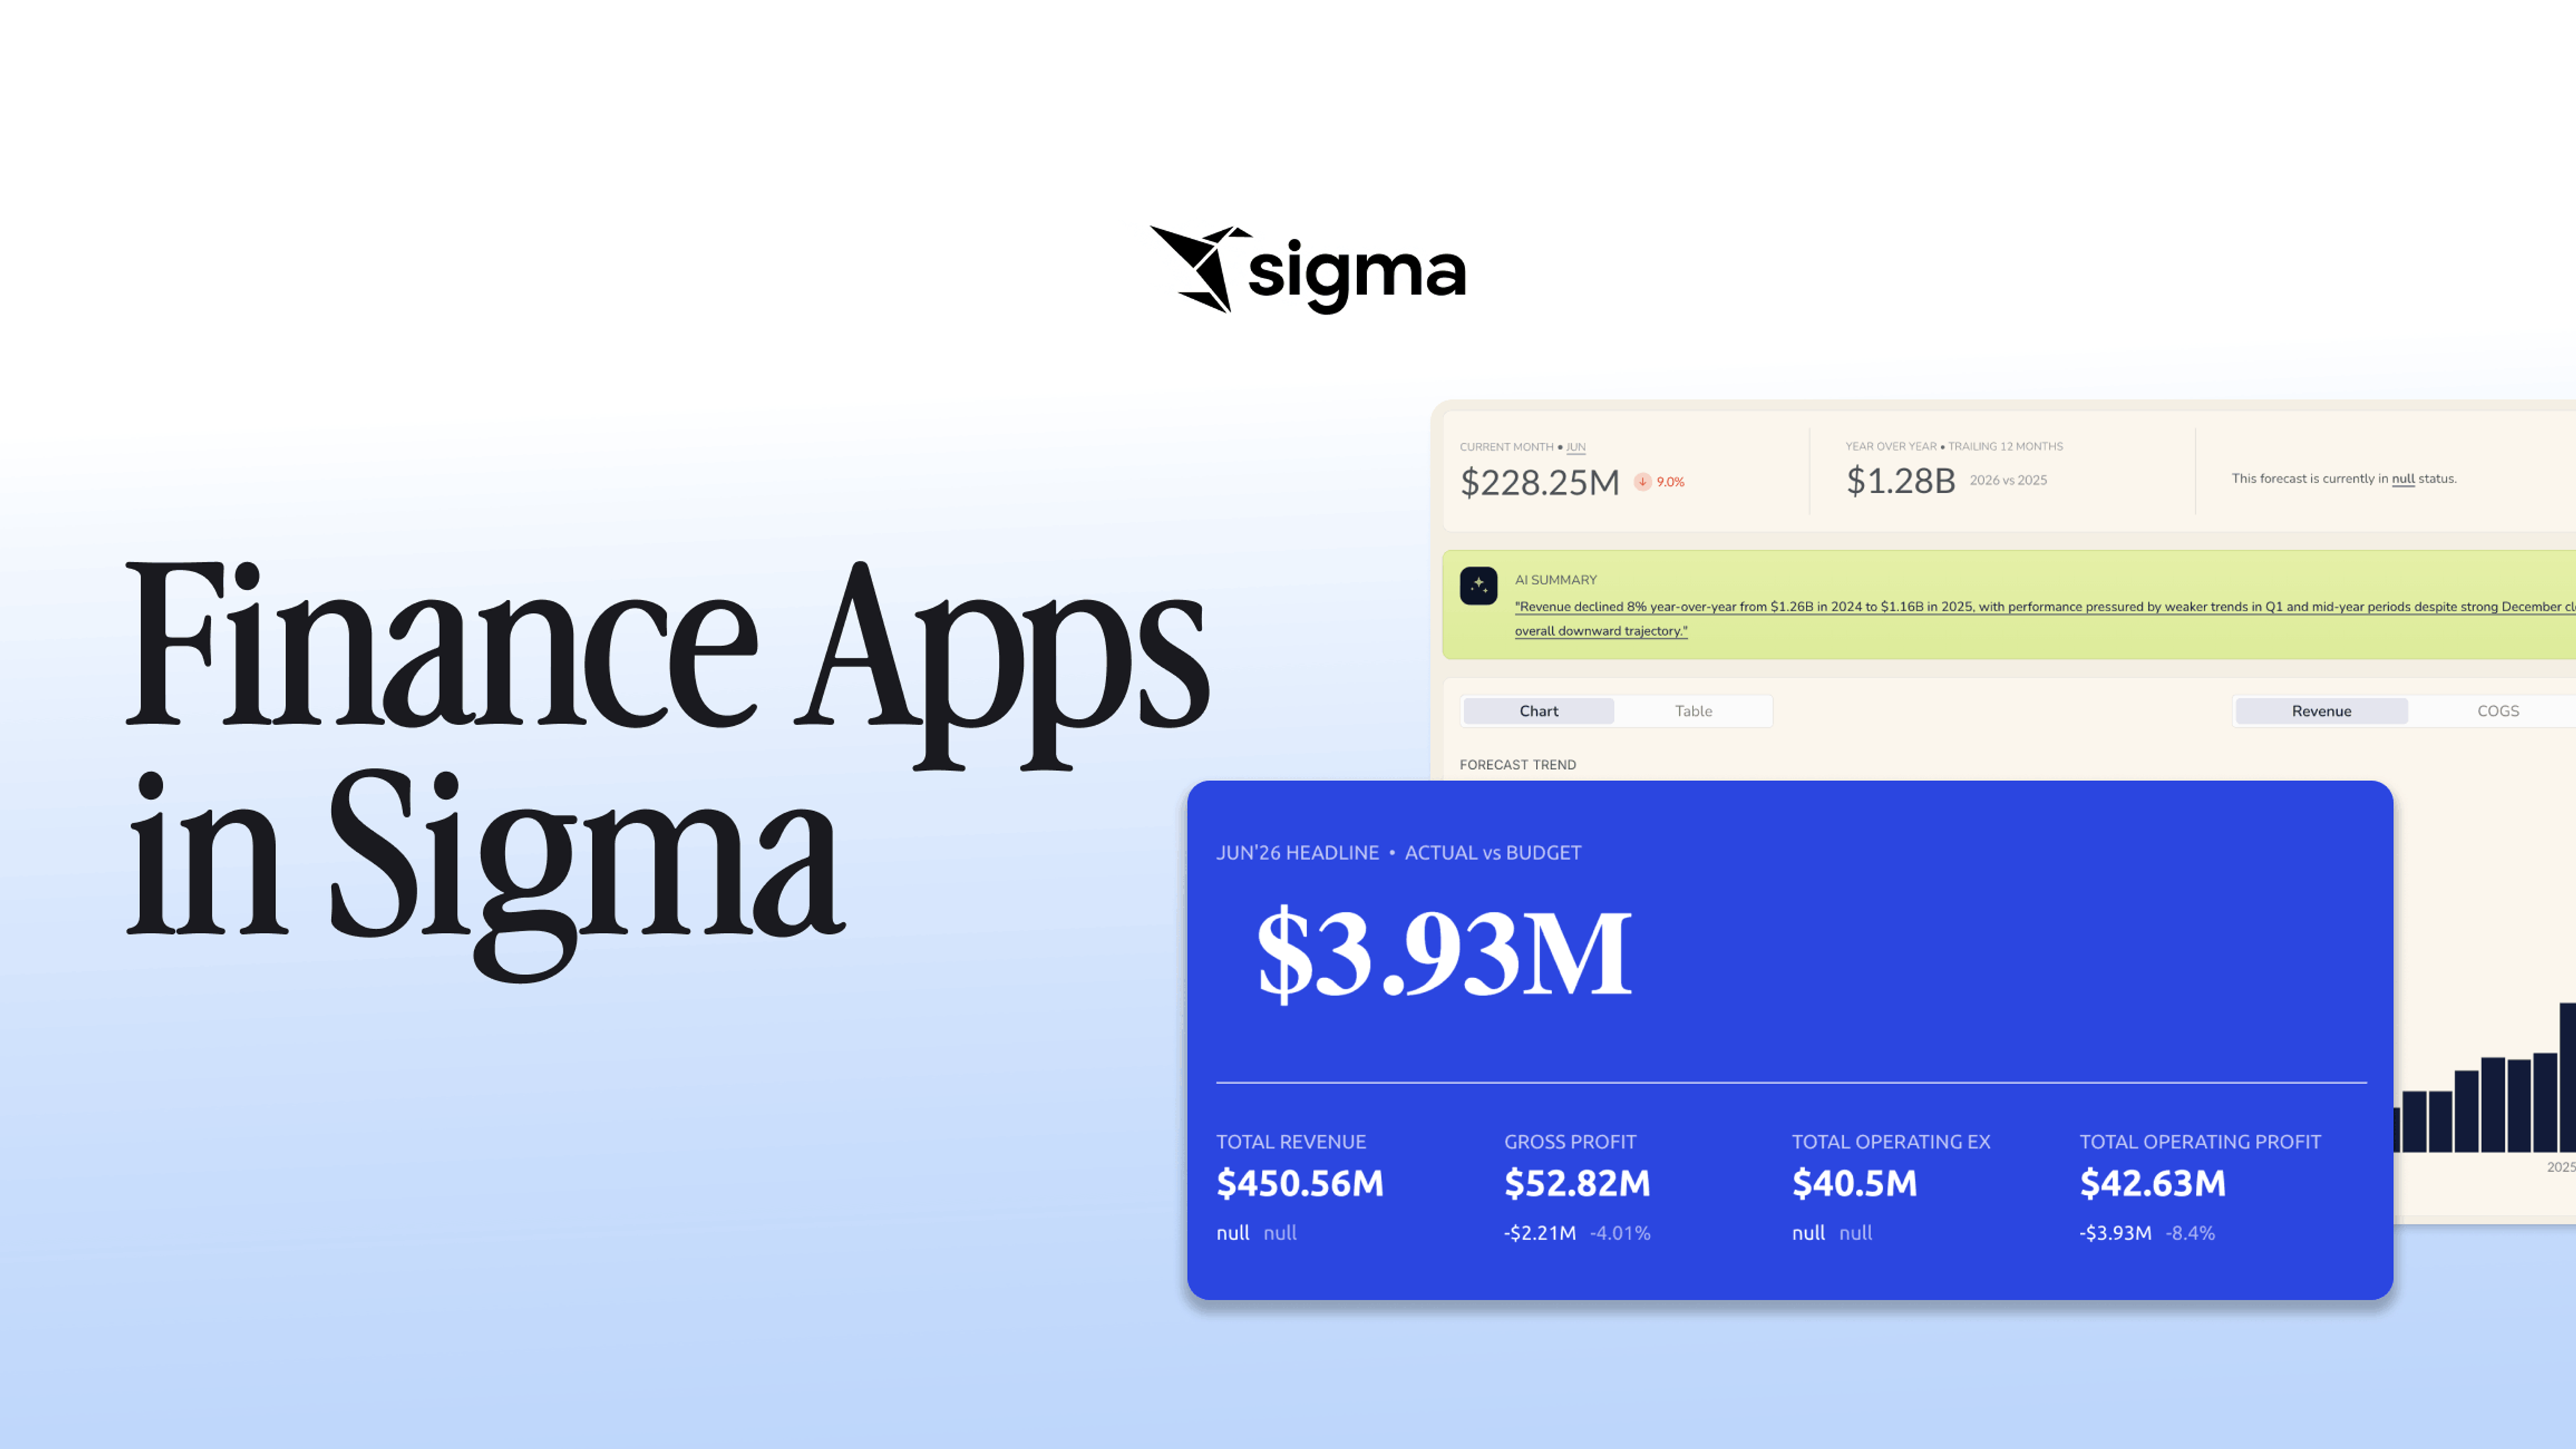
Applications work differently. They allow you to interact with the numbers directly, add context where it belongs, and move between summary and detail without leaving the environment where the data lives. Treating the P&L as an application brings modeling, narrative, and scale into the same governed system. Let’s take a quick look at how we do that in Sigma:
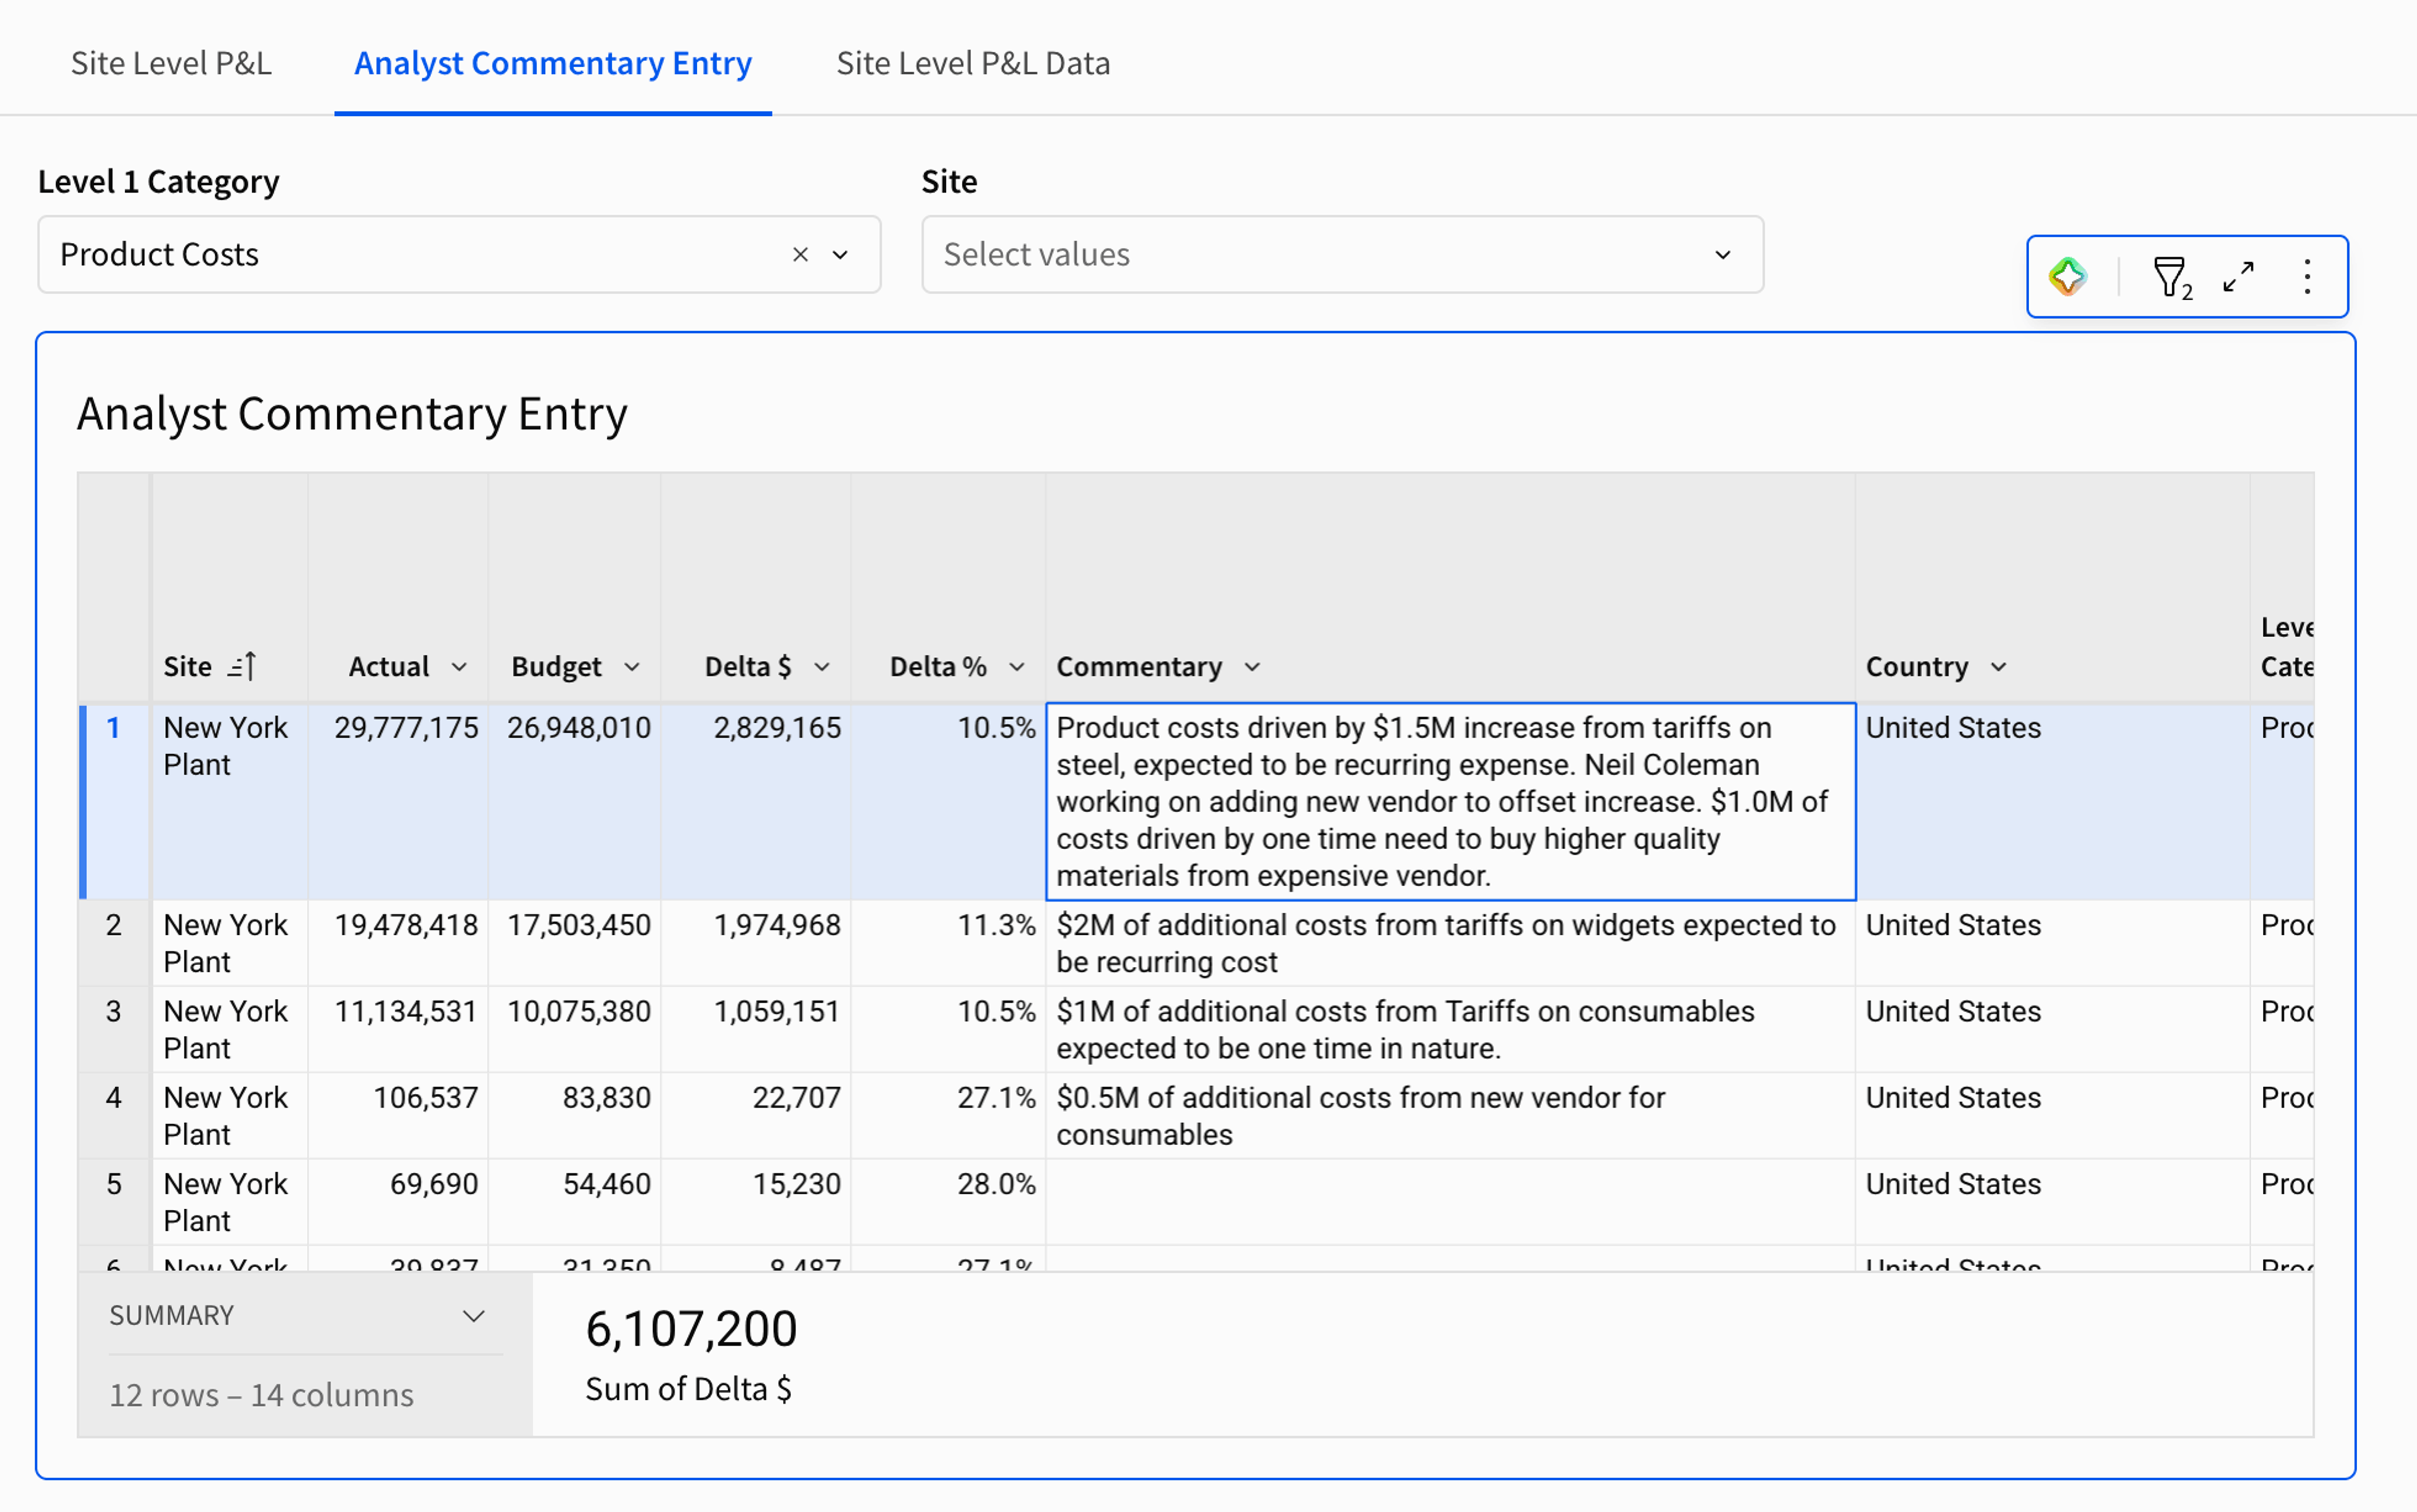
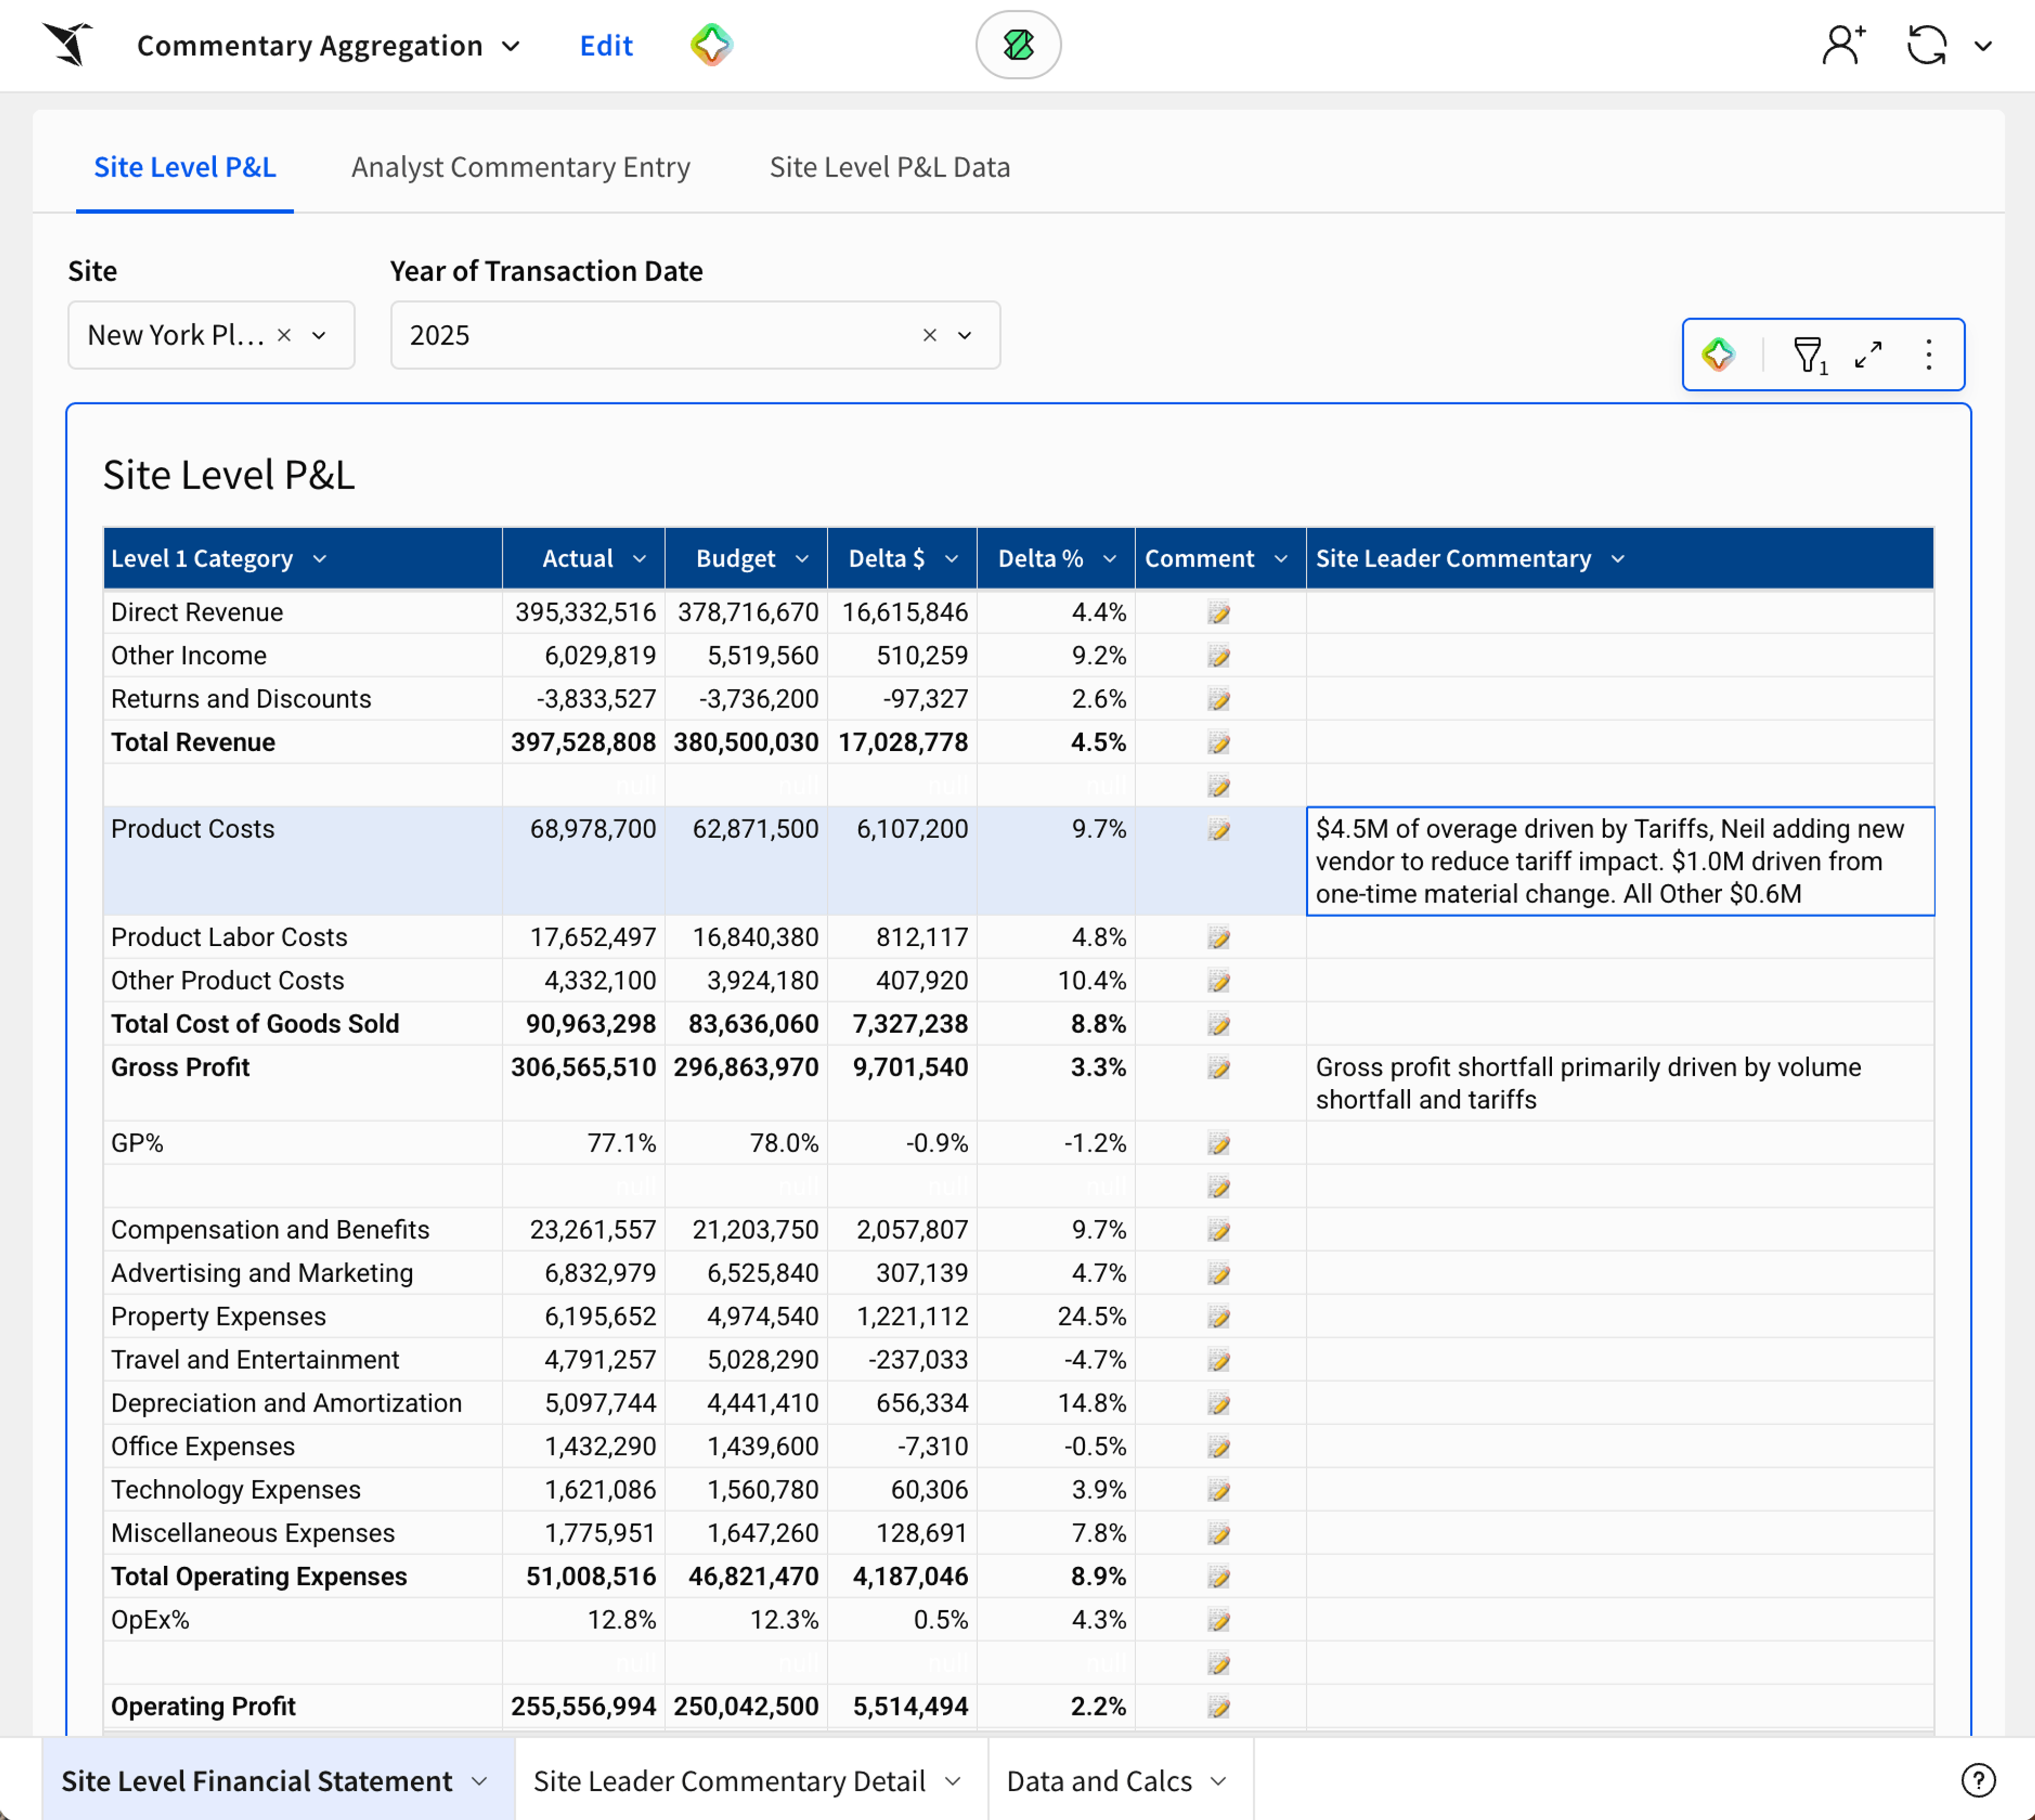
The most important distinction here is that with a P&L application, like this one we built in Sigma, you can add commentary directly to the data alongside the financial logic itself. When you click into product cost, for instance, you should be able to see how it breaks down by site, department, or account, and understand exactly what drove the movement. That only works if the underlying data can operate at scale. And that might mean millions of rows depending on the size and scale of your business. Excel can manage a small dataset, but that level of granularity can only be handled reliably through an application.
Elimination of Manual Aggregation Risk
When numbers live in a BI tool and commentary lives in a slide deck or spreadsheet, you get three problems that compound over time:
- Version drift: The numbers change but the text doesn't keep up.
- Formula errors: Manual copy-pasting during aggregation leaves risk for inaccuracy.
- Lack of auditability: There's no clear trail of who said what or when.
But with Sigma, you can keep the data and the explanation in the same governed system, so the narrative always matches the latest numbers.
Put AI to work on the why
Once commentary and financial data live in the same governed system, something important changes: the context stops being disposable. You can go back and see what drove a variance three months ago, who owned it, and how it was resolved. That alone changes the durability of your insight.
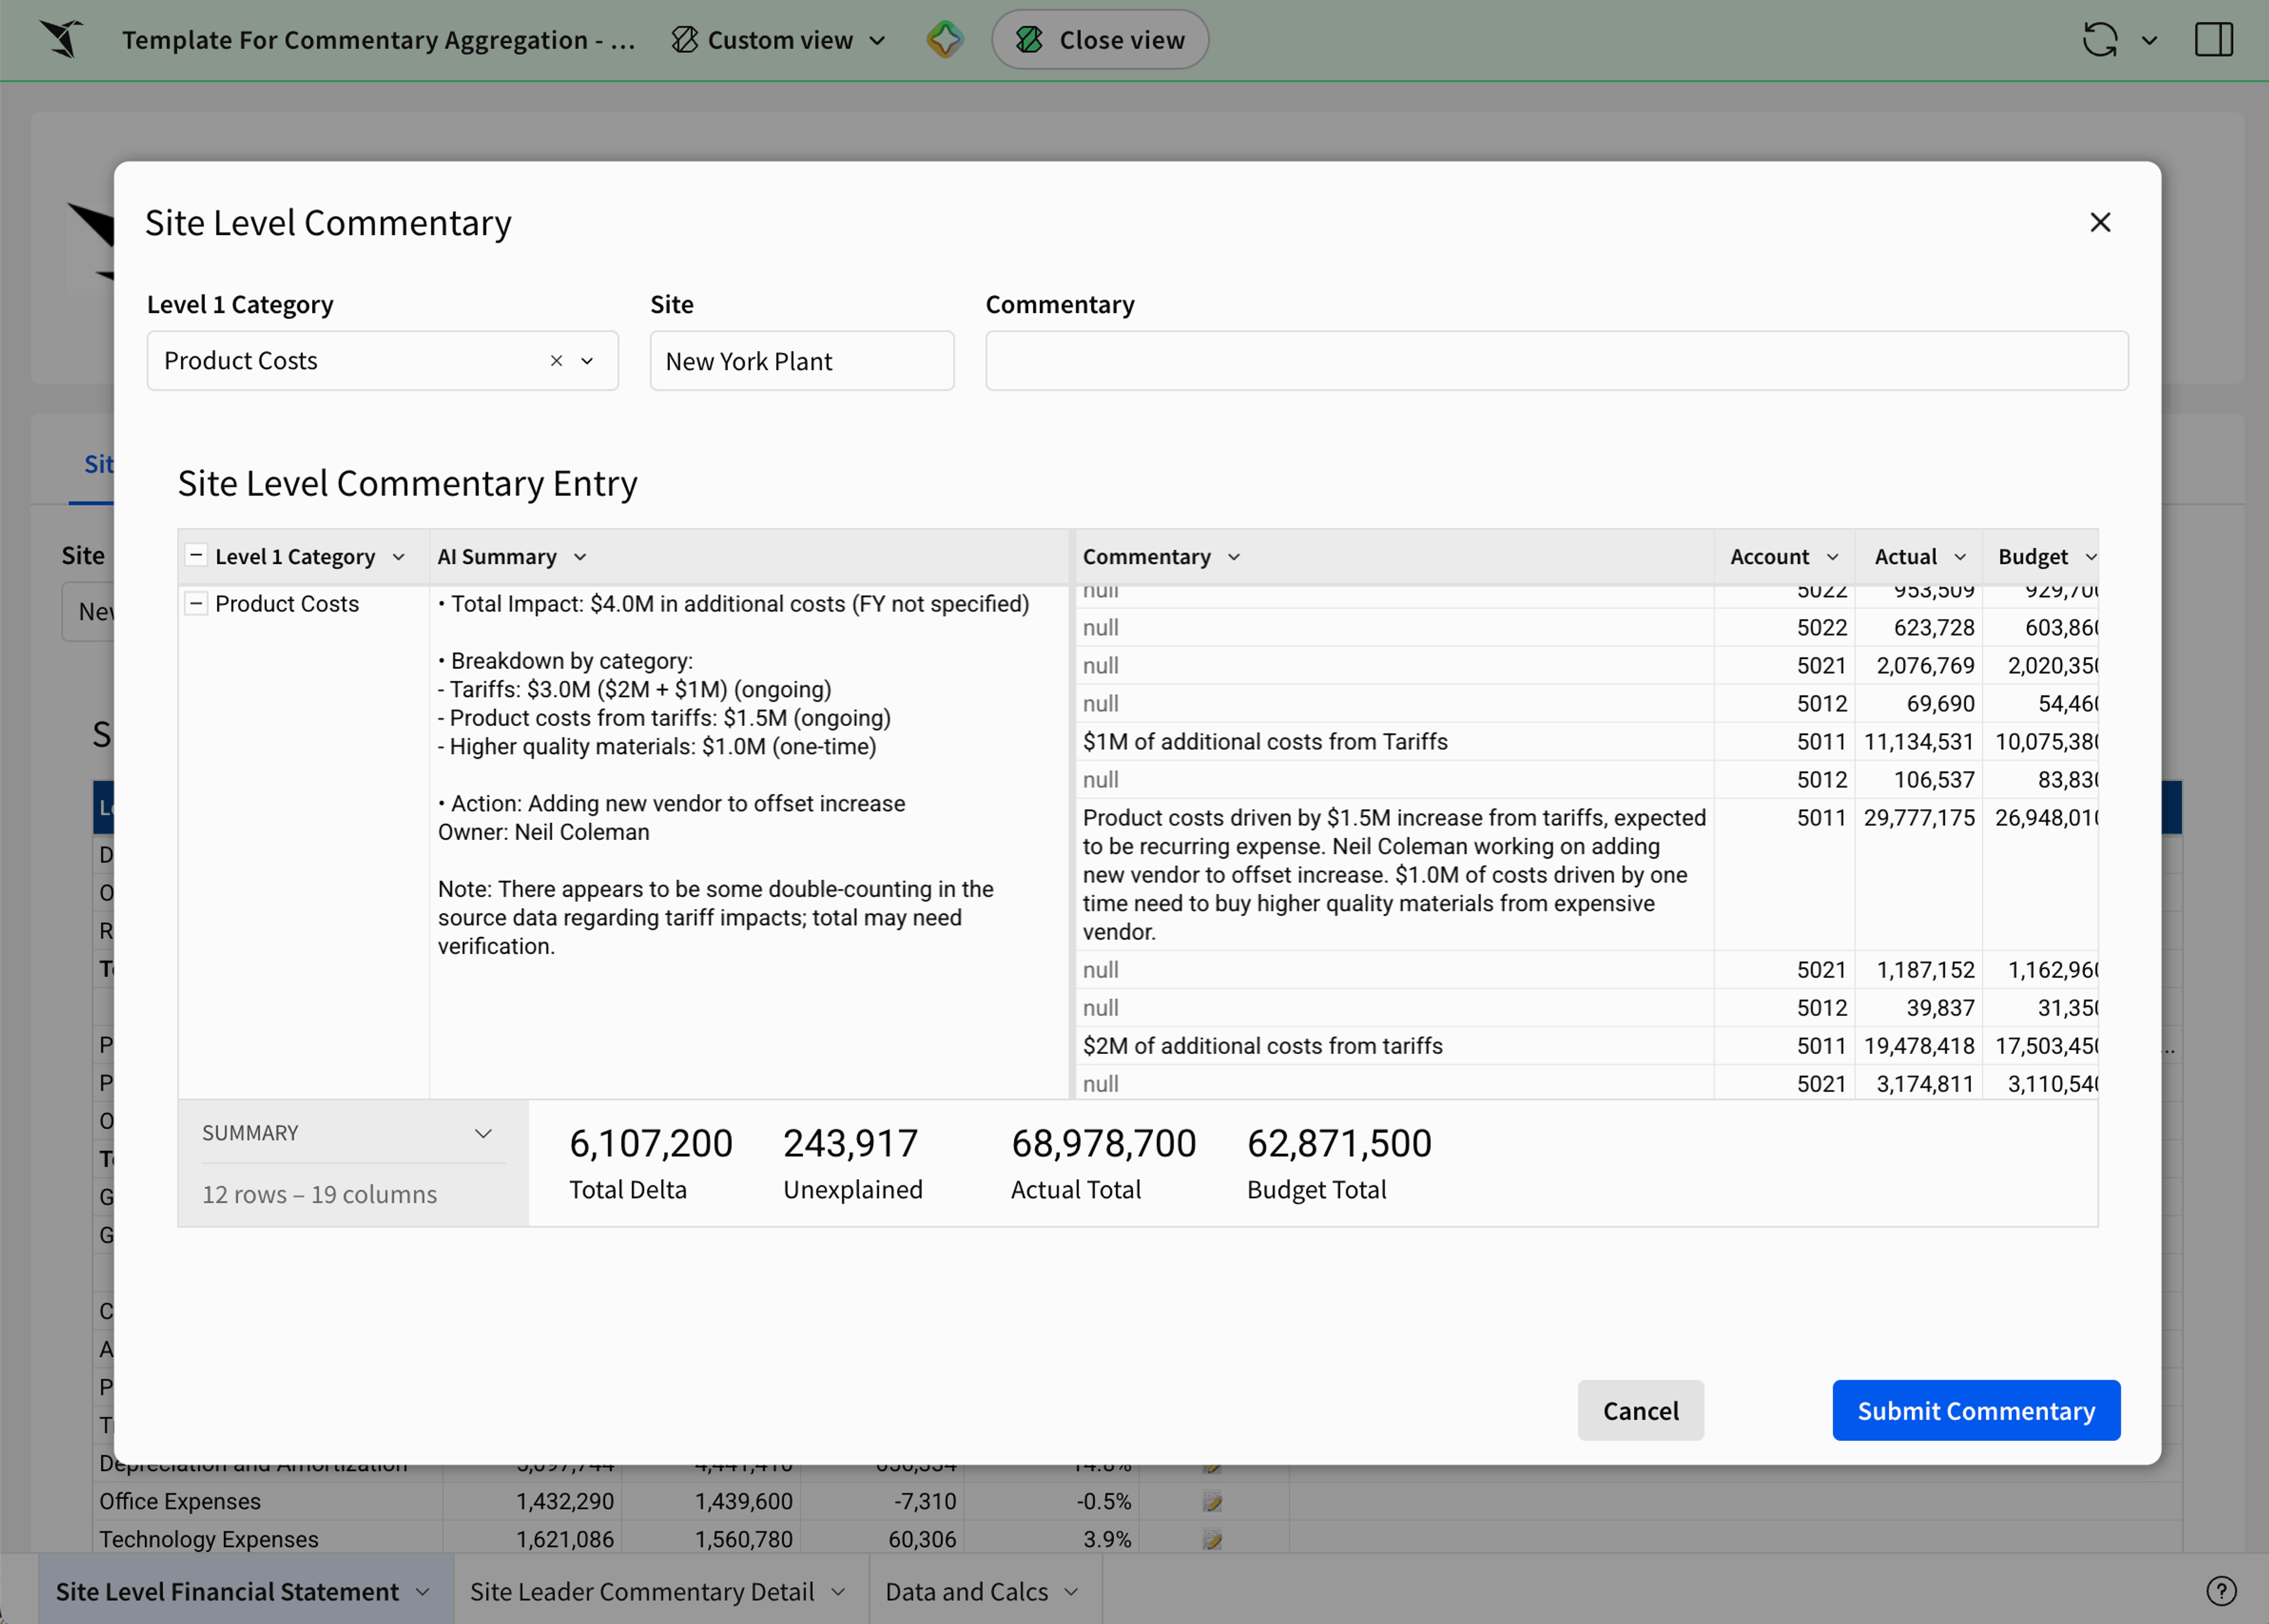
But it also opens the door for AI to do something useful. When I was an analyst, the process was manual—download the data, export it, run calculations, and then spend time figuring out the drivers. Today, that driver analysis doesn’t need to start from scratch every month. AI agents can:
- Categorize variance: Automatically group drivers by department, site, or account
- Surface patterns: Identify recurring issues across periods that human eyes might miss
- Improve commentary quality: Ensure important details like explanation thresholds, recurring vs. non-recurring splits, and actions and owners are included.
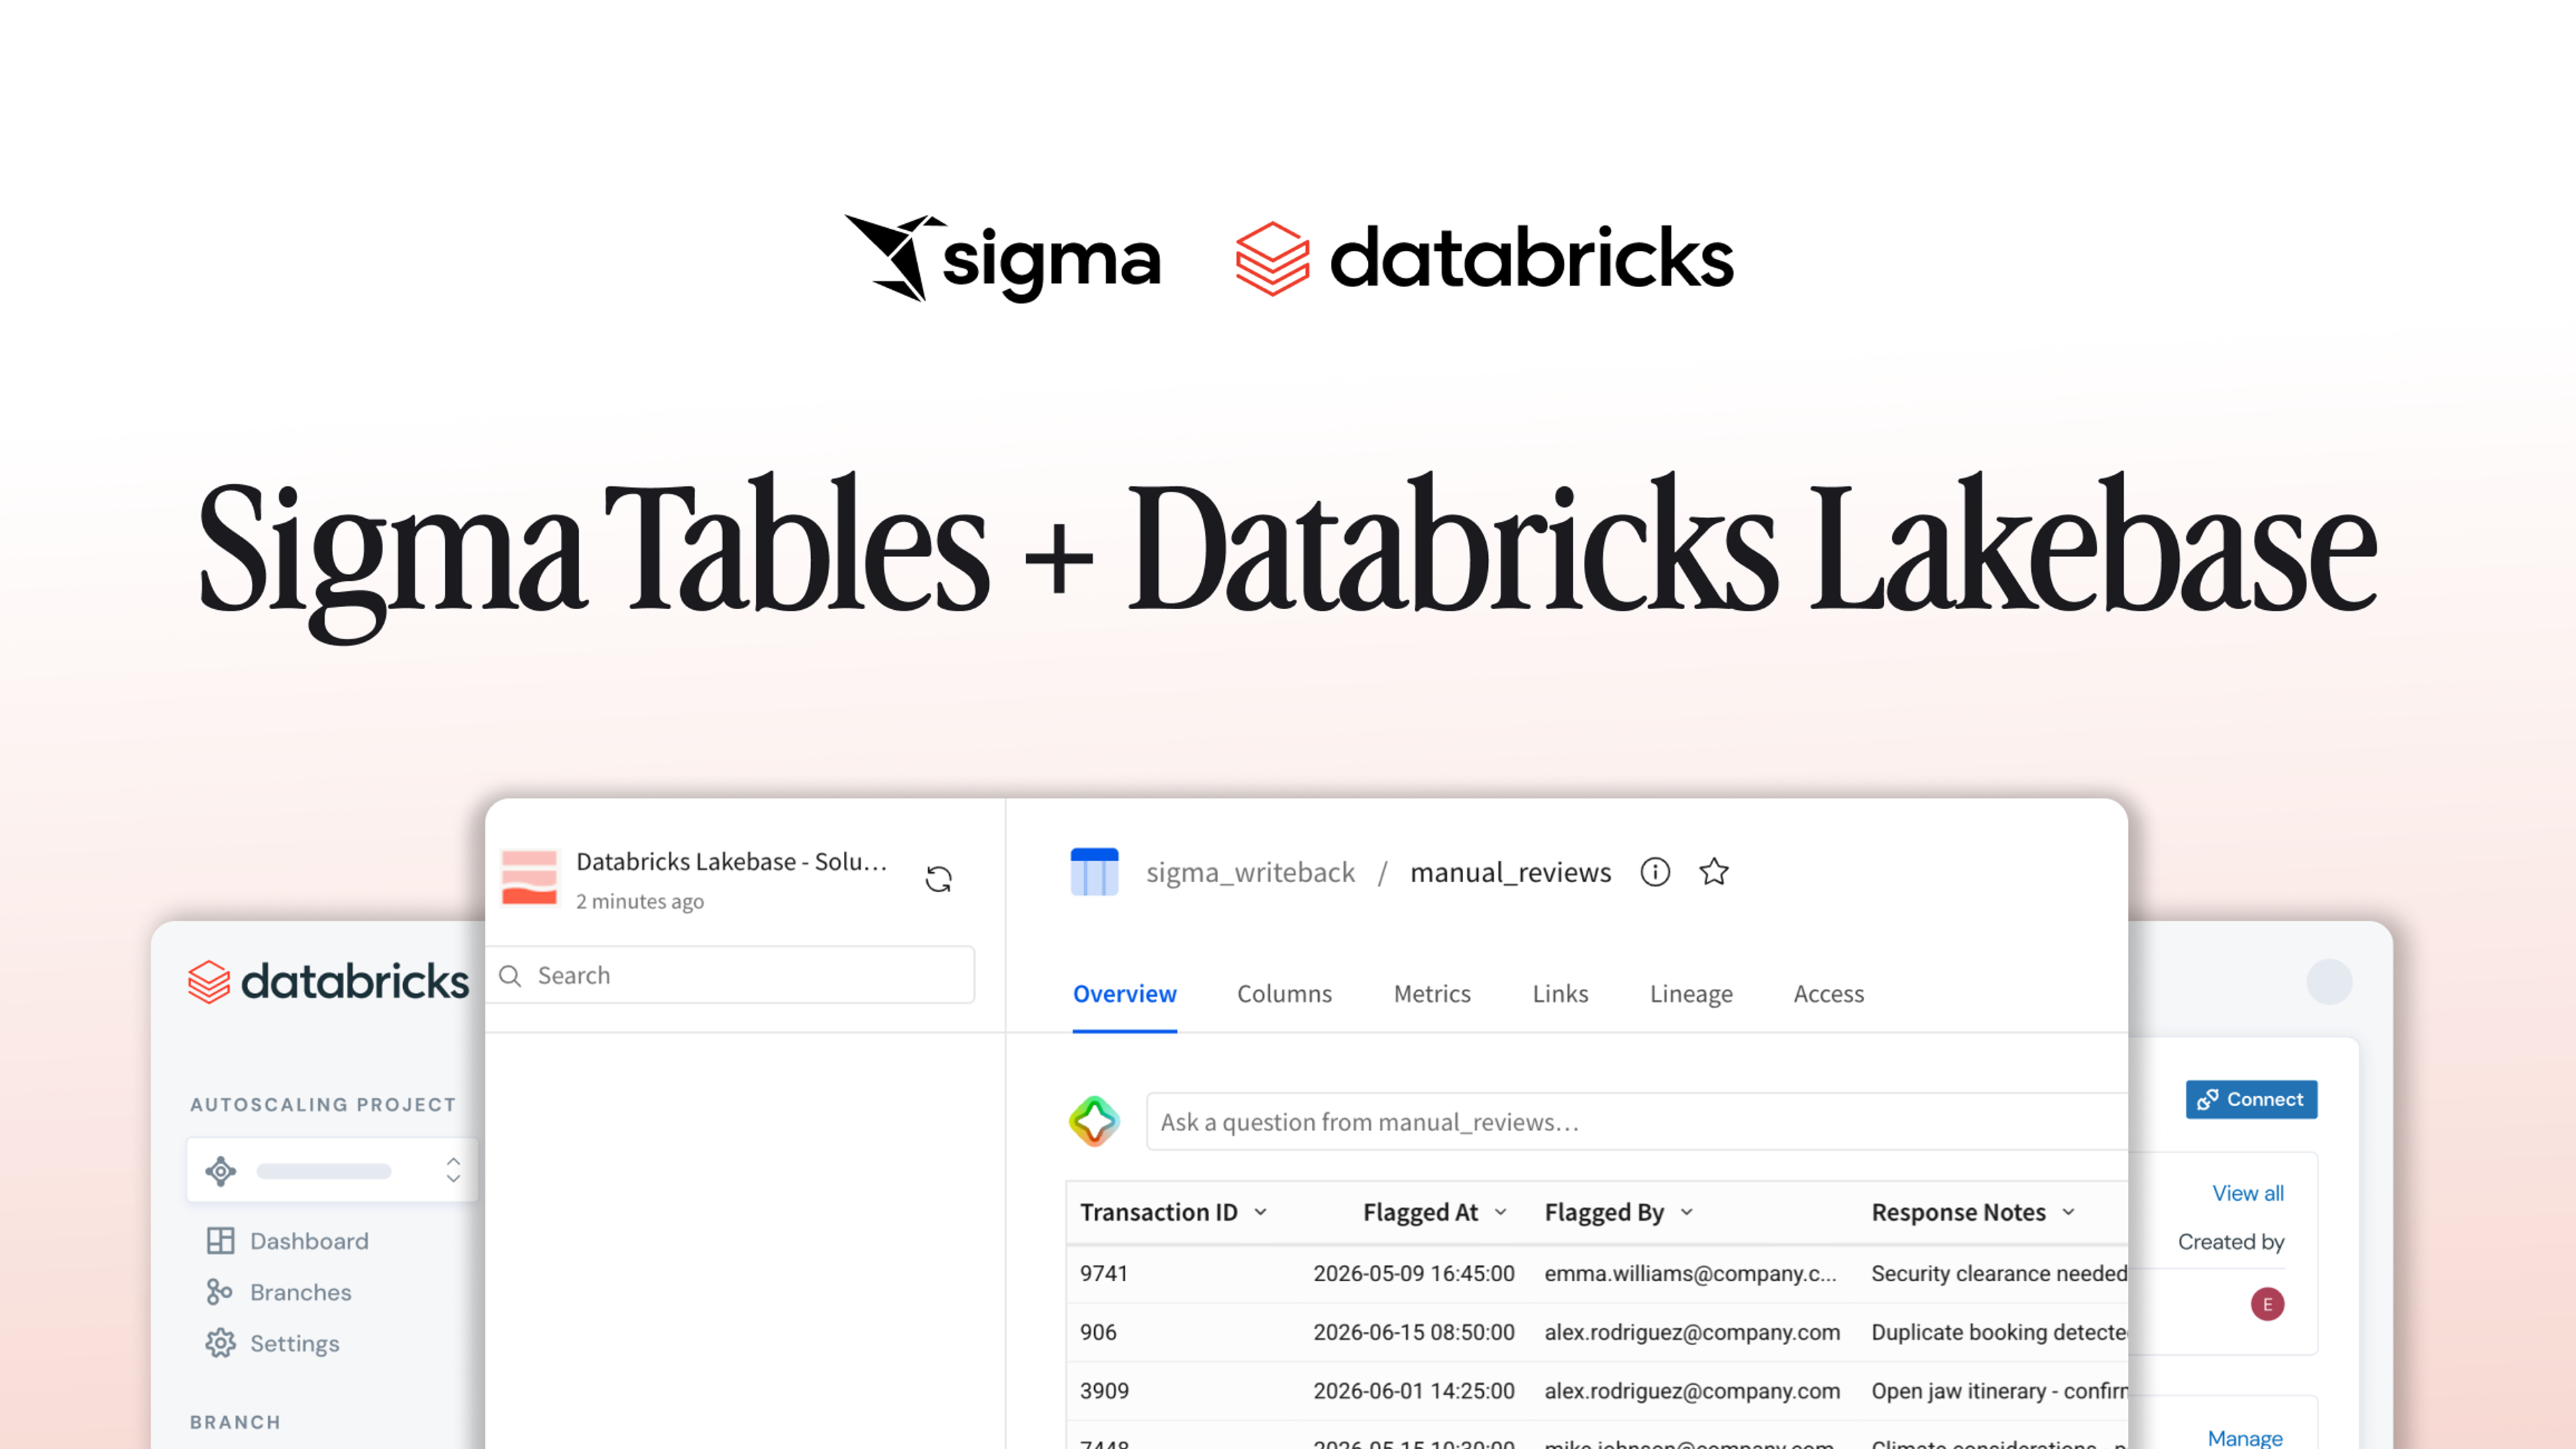
However, anytime you add AI to a business process—especially something as critical as financial closes—governance and security are paramount. You can’t vibe code apps into production without a rigorous IT review; you can’t let any AI Agent loose on your data.
But when you build AI Apps within Sigma, or leverage Sigma Agents in your financial analysis, you’re able to accelerate with AI that lives within your secure and governed warehouse infrastructure. The data, commentary, and even LLMs live in secure environments (your cloud data warehouse) already vetted by finance and IT.
Why this elevates the role of finance beyond reporting
When you combine structured financial modeling, stored commentary, and AI-assisted analysis, the role of finance begins to shift. Historically, most tools have been very good at answering one question: “What happened?” But strong finance teams think in three layers: “What happened? So what? Now what?”
The “so what” is where you interpret why something occurred and whether it matters. The “now what” is where you decide what to change. If churn increased, was it intentional? Did we exit a segment, or did we fail to execute? Those are different stories, and they demand different responses.
In a reactive workflow, finance spends most of its time getting to the first answer. In a modern workflow, the system helps surface the drivers and organize the narrative, so the team can focus on partnering with operations, marketing, or sales to improve outcomes. That’s often what finance leaders are really looking for: closing the books faster, reducing error-prone reconciliation, gaining clearer visibility, and freeing the team to improve the business rather than just explain it.
Rethinking the workflow around the P&L
The P&L doesn’t need to change. The workflow around it does.
When modeling, commentary, and analysis live in the same system, finance stops exporting insight and starts operationalizing it. Add AI to surface the drivers, and the conversation moves from reporting the past to shaping what happens next.
At Sigma, that’s the direction we’re heading with Sigma Agents.
If you're interested in learning more, request a demo today. Or, if you'd like to explore the rest of the sessions shared at Workflow 2026, watch them here on demand.