Classification Models 101 For BI: Turning Labeled Data Into Decisions

Business intelligence is most valuable when it supports decisions in motion. Reporting on last quarter’s sales has its place, but leaders need to know who might leave next month, which transactions deserve closer scrutiny, and which leads are most likely to convert. These are forward-looking questions, and classification models provide one way to answer them. Classification models learn from labeled historical data to forecast outcomes. They can identify which customers are likely to leave, which transactions appear suspicious, and which products may be categorized as defective. When these predictions are surfaced through BI dashboards, they become part of everyday workflows rather than insights hidden in a separate data science tool.
This blog post introduces classification models through the lens of BI. You’ll see how they work, what it takes to build them responsibly, and how they can be evaluated, monitored, and embedded into dashboards in ways that strengthen business decisions.
What is a classification model?
A classification model is a type of supervised machine learning designed to predict outcomes that fall into defined categories. Unlike regression, which estimates continuous values like revenue or temperature, classification focuses on discrete labels such as “yes or no,” “approve or deny,” or “high, medium, or low risk.” It does this by learning patterns in historical data where the outcome is already known and then applying those learned rules to new, unseen data.
The process works by mapping inputs, called features, to an outcome label. For example, in a churn prediction model, features might include customer tenure, product usage, and support interactions, while the label is “churned” or “retained.” Once trained, the model assigns probabilities to new data points, categorizing them into the classes it was taught to recognize.
Classification models sit within the broader practice of supervised learning, where the training data provides examples with both inputs and known outputs. This makes them distinct from unsupervised approaches, which identify structure without labels.
For BI teams, this distinction matters: classification is not exploratory, but targeted toward specific, actionable outcomes. The concept is not new. Retailers like Target once made headlines for using customer purchasing behavior to predict which shoppers were pregnant, tailoring marketing campaigns accordingly. While controversial, the example illustrates how labeled data can be mapped to categorical outcomes that drive business decisions.
In a BI context, classification models are often the engine behind the predictions teams rely on daily. This is commonly used in:
- Churn prediction: determining when customers will leave
- Fraud detection: determining when something is amiss
- Lead scoring: determining which customers are most likely to purchase
- Defect categorization: organizing defective items
They represent decisions that affect revenue, customer trust, and operational efficiency. What once required specialized machine learning environments is now increasingly embedded within BI platforms, allowing teams to classify outcomes directly in their dashboards.
Key ingredients for effective classification
Building a classification model is not just about selecting an algorithm and pressing “run.” The foundation of success lies in the data and design choices made long before the model is deployed. Without careful preparation, even the most advanced method will produce results that fail to guide business decisions.
Data quality
Models are only as reliable as the information they consume. If the training set contains missing values, inconsistent records, or a narrow view of the population, the model’s predictions will skew. For example, a churn model trained only on urban customers may miss the behaviors of rural users, limiting its accuracy when applied broadly. Cleaning, standardizing, and validating inputs are not glamorous tasks, but they are essential to ensuring model reliability.
Feature design
Features are the measurable inputs that feed a model, and their selection requires both technical skill and domain knowledge. A model predicting fraud may include transaction amount, time of day, and location, but without features that capture user behavior patterns over time, the picture remains incomplete. Feature engineering often adds as much value as the algorithm itself, since it encodes the nuances of the business context into the dataset.
Class balance
Many BI problems involve outcomes that are not evenly distributed, such as rare fraud events or occasional defects. When one class dominates, accuracy can be misleading; for instance, a model predicting that “no fraud occurs” will look correct most of the time but miss entirely the few cases that matter most. Adjusting for imbalance through resampling techniques or custom metrics ensures the model doesn’t default to the majority class.
Target variable alignment
A well-labeled outcome isn’t enough if the predicted categories don’t map to meaningful interventions. Predicting churn likelihood is valuable only when the result informs retention campaigns. Predicting product defects is only beneficial if operations teams can act on the provided categories. Effective models are built with the end decision in mind.
Embedding classification models into BI dashboards
A model sitting in a data science notebook or tucked away on a server has little value unless its predictions are brought into the tools where business users work every day. For most organizations, that means integrating classification results directly into BI dashboards. Doing so makes predictive insights part of regular workflows instead of something that requires separate systems or technical specialists to interpret.
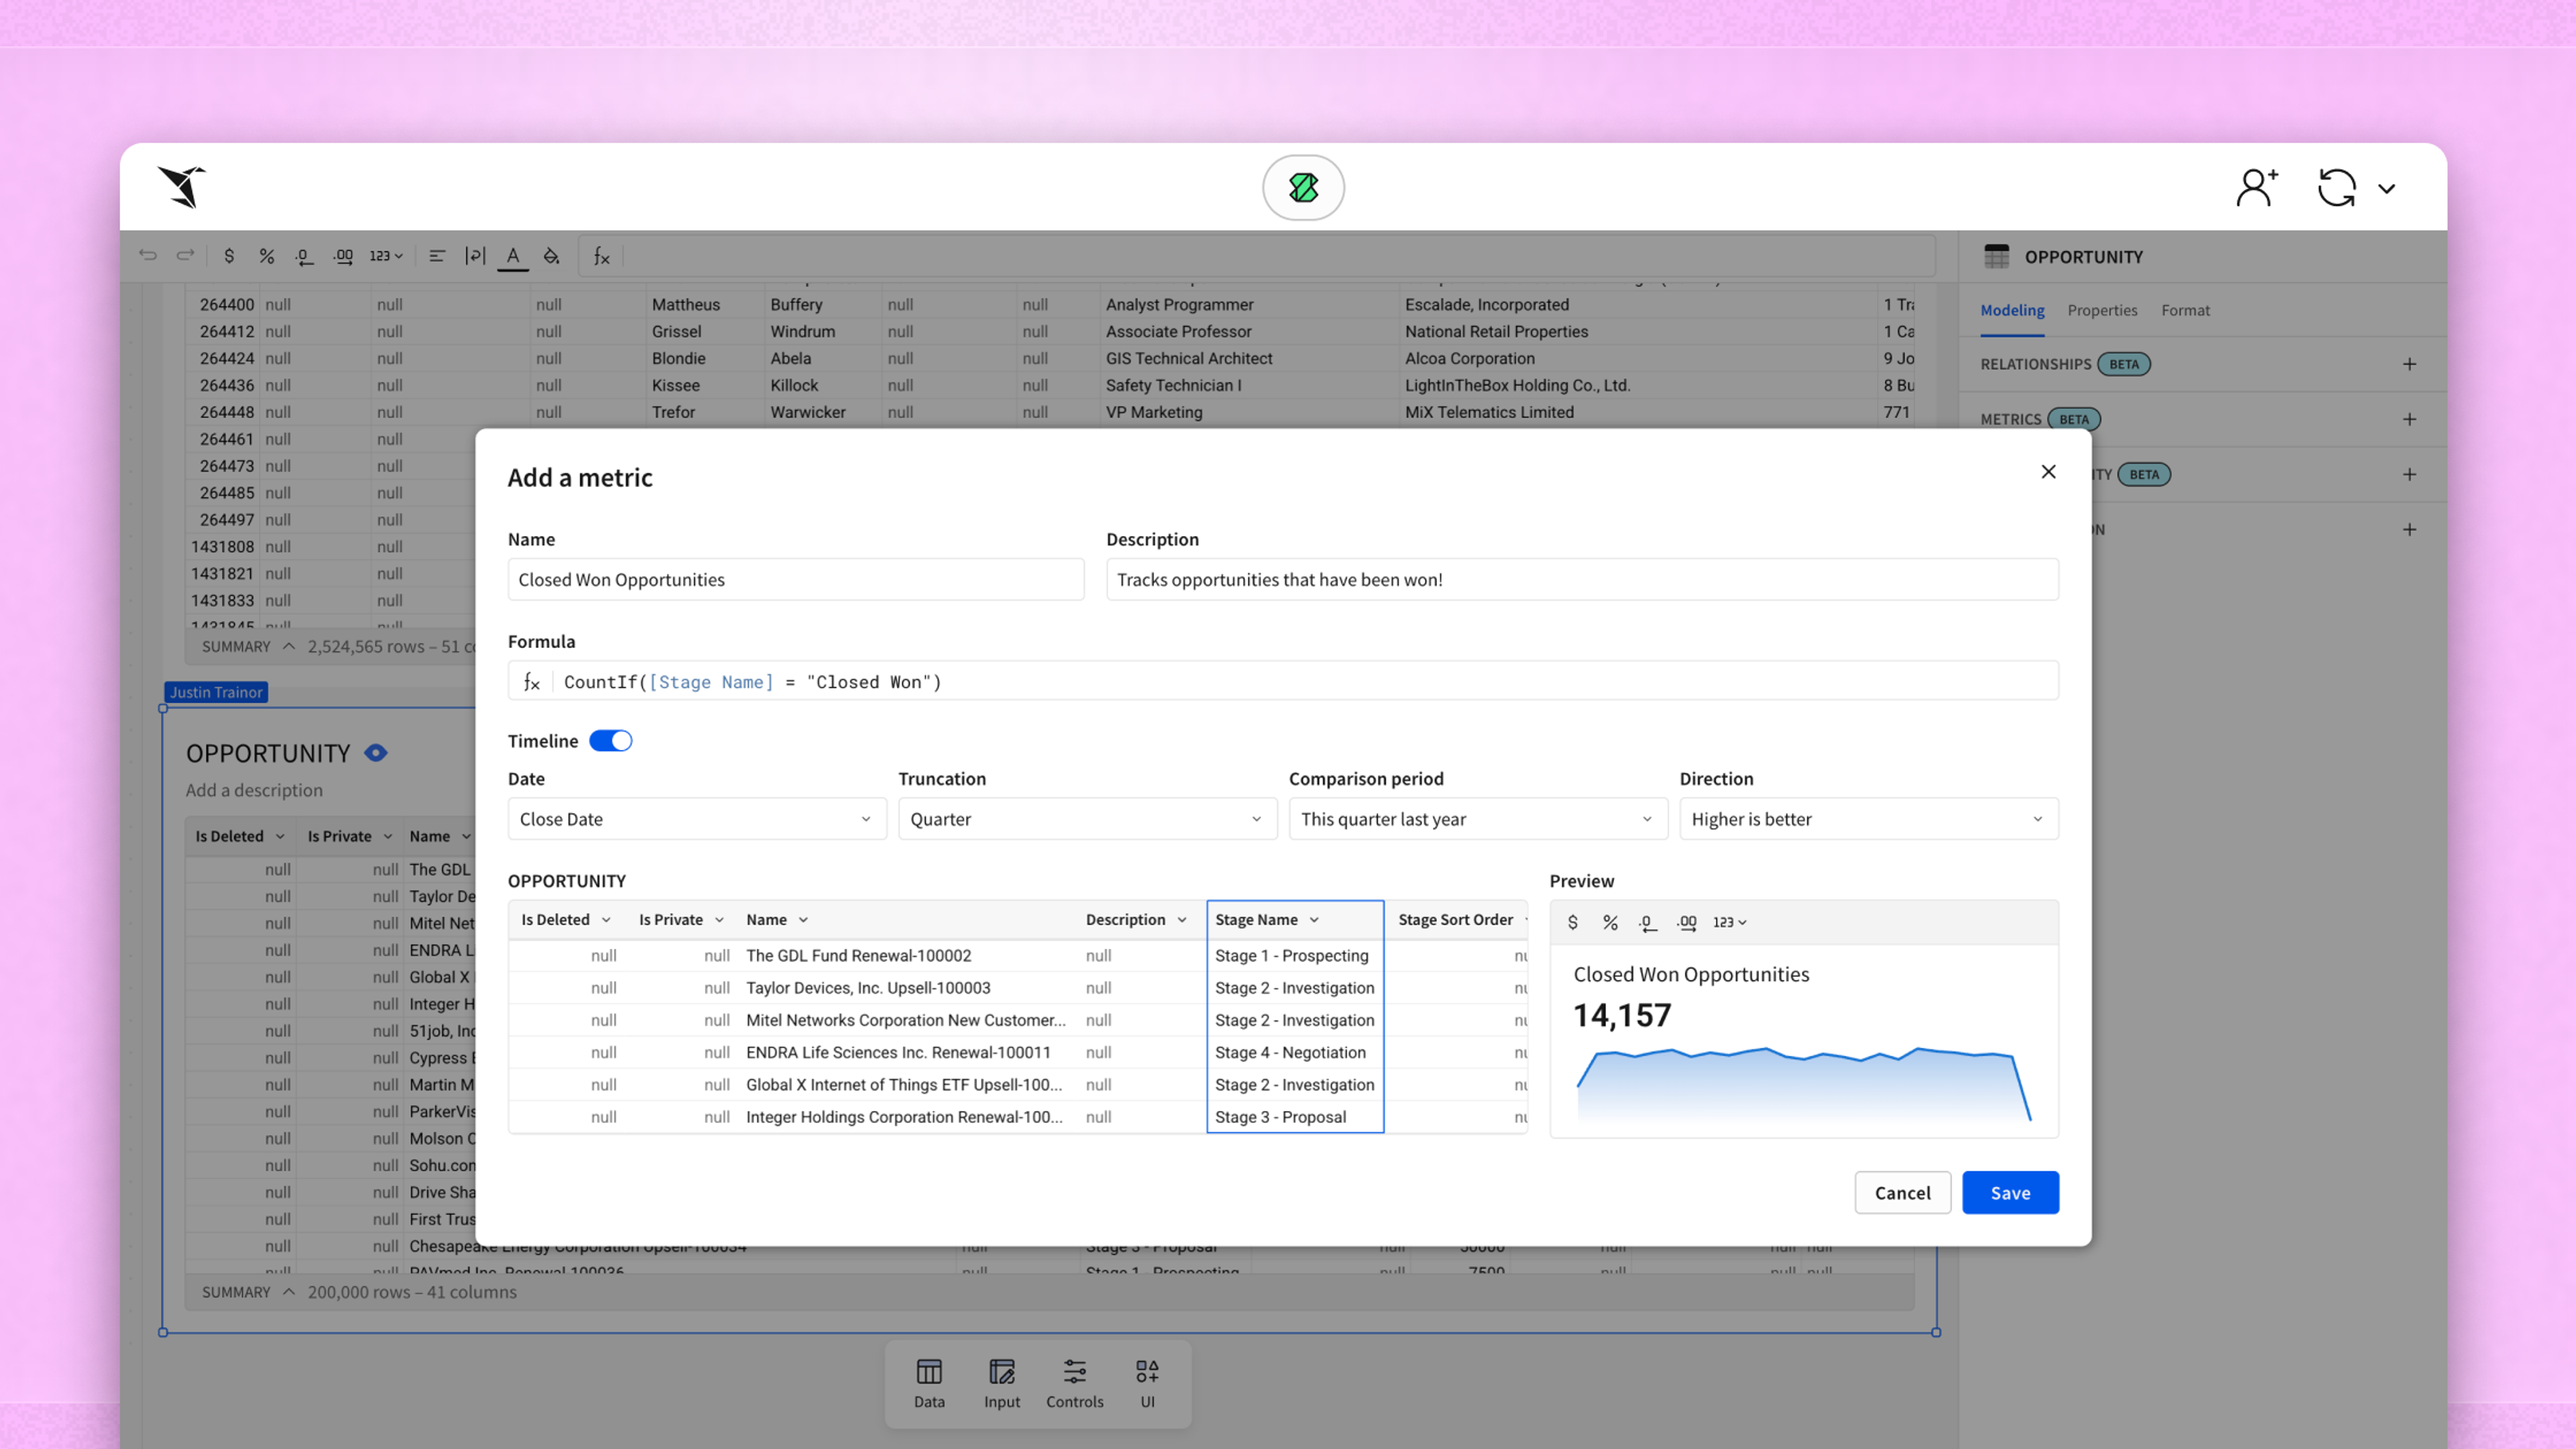
One practical step is creating fields in dashboards that display prediction scores. For example, a customer table might include a churn probability column, allowing a success manager to sort accounts by highest risk. This transforms abstract probabilities into tangible priorities, guiding which clients to call first.
Segmentation is another effective approach. Instead of treating prediction scores as static numbers, teams can filter or group data by outcome categories. A sales dashboard, for instance, could highlight leads predicted to have a “high conversion likelihood,” allowing representatives to focus their outreach where it is most likely to pay off. When integrated this way, classification outputs shape actions rather than sitting passively in the background.
Visualization also plays an important role. Pairing predictions with confidence levels or related metrics gives users context for weighing decisions. A dashboard showing both revenue trends and churn risk percentages provides a fuller picture of customer health than either measure on its own.
Embedding models directly into BI is also about creating trust. When predictions appear within familiar dashboards, users are more likely to explore them, compare them to existing measures, and develop confidence in acting on them. The closer the classification results are to the point of decision, the more likely they are to influence business outcomes.
How to evaluate classification model performance
Once a classification model is built, the next challenge is determining whether it performs well enough to support business decisions. Accuracy, the most commonly cited metric, is rarely sufficient on its own. In practice, a model can be “accurate” most of the time while failing to deliver value where it matters most.
Consider a fraud detection model. If fraud occurs in only 1% of transactions, a model that predicts “no fraud” for every case will achieve 99% accuracy but provide zero protection. This is why precision and recall are so important. Precision measures how often predicted positives are correct, while recall tracks how many of the true positives the model captures. In fraud detection, recall is often prioritized, since missing a fraudulent case can carry higher costs than investigating a few false alarms.
The confusion matrix provides a structured way to evaluate these trade-offs. By mapping predictions into true positives, false positives, true negatives, and false negatives, it creates a clear view of where errors occur. For BI teams, this helps translate technical outcomes into practical consequences. A false positive might mean reaching out unnecessarily to a customer flagged as high risk, while a false negative could mean losing a customer entirely.
Another tool is the ROC curve and its summary statistic, the area under the curve (AUC). This metric shows how well the model distinguishes between classes across different thresholds, offering a broader perspective than a single accuracy score. A model with a high AUC indicates stronger separation between categories, which is valuable when decisions involve adjusting thresholds over time.
Most importantly, evaluation must be tied to the business context. The costs of errors vary across different use cases. In healthcare, a false negative might represent a missed diagnosis with serious consequences, while in marketing, the stakes of a misclassified lead are much lower. Choosing evaluation metrics with the business stakes in mind ensures the model provides insight that is not just statistically sound but operationally meaningful.
Monitoring model performance over time
A model that performs well at launch may degrade as customer behavior and business conditions change. Without ongoing checks, predictions lose their connection to reality. Tracking prediction distributions helps reveal unusual shifts. If a churn model suddenly predicts that half of all customers are at risk, the spike may indicate either a genuine trend or a model failure. Examining these shifts side by side with historical baselines helps distinguish between the two.
One way to track stability is by reviewing prediction distributions over time. For example, if a churn model that once predicted 20% of customers at high risk suddenly flags 60%, the shift could reflect either a meaningful trend in the business or a problem in the model. Looking at distributions side by side helps teams spot unusual patterns before they cause bigger issues.
Error analysis is another safeguard. By segmenting false positives and false negatives, BI teams can see whether mistakes cluster around specific groups or conditions. If a fraud detection model repeatedly misses cases from a particular region or customer segment, that’s a sign of hidden bias or incomplete training data. Monitoring errors in this way transforms mistakes into learning opportunities that improve future iterations.
Regular metric monitoring, paired with alerts for sharp drops in precision, recall, or AUC, keeps teams aware of declines before they spread through the business. A sudden decline in precision or recall signals that the model may no longer represent current conditions. By embedding these checks into BI reporting, organizations can detect performance issues in the same place they track other operational metrics, keeping monitoring tied to day-to-day workflows.
Long-term reliability comes from this vigilance. Without it, predictions lose credibility, and the effort invested in building the model goes to waste.
Common mistakes to avoid when using classification in BI
Even well-designed classification models can fall short when they are implemented carelessly. For BI teams, the challenge is less about the algorithms themselves and more about how predictions are interpreted and applied within dashboards and reports. Avoiding a few recurring pitfalls makes the difference between a model that informs strategy and one that confuses it.
Focusing solely on accuracy
Imbalanced datasets make accuracy misleading, as with fraud detection, where rare cases can vanish under the weight of majority class predictions. A model that predicts “no churn” in nearly every case may appear to perform well, yet it fails to catch the customers most at risk. Without examining precision, recall, and other measures, teams risk presenting numbers that look reassuring on the surface but provide little value for decision-making.
Abandoning your model after deployment
Models that are never reexamined after launch often degrade quietly, leading users to act on outdated insights. Failing to schedule reviews, compare predicted outcomes against reality, and investigate errors leaves blind spots that accumulate over time.
Hardcoding thresholds
The line between “high” and “low” probability is not fixed forever; it depends on shifting business priorities and conditions. A churn threshold that made sense when retention was stable may be far too conservative in a period of higher customer turnover. Revisiting thresholds ensures the model’s predictions continue to guide the right actions.
Cutting out human judgment
Over-automation creates risks. Classification outputs are best used to inform and guide, not to replace human judgment entirely. Removing human review from sensitive contexts such as fraud investigations, medical assessments, or credit approvals can create trust issues and costly mistakes. Keeping humans in the loop provides a safeguard against errors that a model cannot catch on its own.
The practical value of classification models
When grounded in strong data, evaluated carefully, and monitored over time, classification models extend the reach of BI. They shift dashboards from places of historical reporting to platforms for forward-looking action. The business value becomes clear when predictions translate into measurable results: a marketing team reducing churn by targeting high-risk customers, a fraud team saving hours by focusing only on the riskiest transactions, or an operations team cutting costs by classifying defects quickly.
What matters is not the novelty of the algorithm but how well the model’s outputs tie to the business case. Predictions that connect to outcomes such as revenue retained, costs reduced, or risks mitigated give BI its greatest impact. Classification models are not a replacement for human expertise, but they amplify it. When embedded thoughtfully into BI, they provide an early warning system, a way to prioritize actions, and a bridge between data and decision-making.