Move Beyond Static Spreadsheet Analysis and Act on Insights in Real Time
Whenever someone wants to understand what’s happening in their business, they typically start with a spreadsheet. Say a retail company sees revenue drop in their East region. Their data team will pull the latest data, build a pivot, and find the cell that holds the number they need.
This process worked just fine for decades, when data moved slowly, and weekly or quarterly updates were enough. Today, though, information is captured in real time, but spreadsheets don’t update on their own. This means that as soon as someone adds new data or sorts a column, the references shift and the analysis breaks. But analysis isn’t the end goal. You build it so you can do something with it, like alert a team, adjust a forecast, or act on what you’ve found. That gap between analysis and action is where most teams lose time, context, and opportunity.
The problem isn't your data, it's your spreadsheet
When it comes to working with spreadsheets, there are two core problems. They're the reason every company ends up with a folder full of “Territory Plan vFinalFinal” files and endless email threads trying to make sense of them.
- You don’t work with data, you work with cells: Spreadsheets have taught us all to think about data based on where it lives on a grid, not what the numbers represent. They deeply ingrain a misconception that data is static. Instead of focusing on “revenue in Boston,” users end up chasing whether that value lives in C2 or C10, for example, breaking the connection between the insight they need and the action they want to take. And even the most basic filters can break these fragile formulas, so you have to account for the actions users might take on a spreadsheet.
- Spreadsheets are siloes: Spreadsheets live on desktops or drives, cut off from the systems that power the rest of your business. Inputs don’t flow back into a centralized source, so you’re stuck emailing versions, copying comments, and reconciling edits by hand. Analysis becomes a closed loop when it should be a connected process.
Take territory planning, for instance. Every year, teams redraw boundaries, reassign reps, and update targets. In Excel, that means recreating the entire model from scratch. Each change requires complex formulas just to keep the data and assignments in sync. Add a new territory, and the whole structure needs to be redone. The problem lies in the model because you’re treating every update like an exception instead of part of the workflow.
At the end of the day, you analyze so you can act—and most analytics is part of a workflow designed for you to act. But as long as you’re thinking in cells, you’ll spend more time fixing references instead of improving results.
BI fixed reporting, but the inherent problem remained
BI tried to solve the spreadsheet problem for years. It gave teams a way to visualize and report on data without breaking formulas or emailing versions around. BI in the 1990s delivered reporting at scale. BI in the 2000s added dashboards and prettier charts. But when it came to analyzing, planning, or taking action, everyone still downloaded to Excel.
That’s because BI has always been read-only. You can see what’s happening, but you can’t act on it or bring business judgment into the flow of data. The feedback loop breaks the moment someone needs to make a decision or add context. Insight lives in BI, but action still happens somewhere else—usually in spreadsheets.
What teams really need is a read and write experience, built for live data. A place where analysis and action happen together, where you can test assumptions, write back updates, and see the impact instantly without copying or refreshing anything. That’s the new world Sigma makes possible.
Rethinking the spreadsheet with Sigma
Sigma helps you think about data the way it actually is—dynamic, connected, and constantly changing. By bringing together the intuitive experience of a spreadsheet and the power of SQL, Sigma gives you a layout that feels the same as a spreadsheet, but with a totally different foundation. It’s connected directly to your data warehouse, so instead of copy-pasting new data every week, the numbers simply update.
Remember the territory planning example from earlier? Sigma solves that problem with the territory management AI app that enables a manager to update a territory, reassign a ZIP code, or change a deal status, while everything downstream updates automatically. Data from CRM, ERP, and other systems stays connected, so you’re never rebuilding logic or fixing references. Instead of wrestling with formulas to keep territories and data in sync, you’re simply working with live information. Every change is reflected instantly across your models and reports.
And that’s just one example. With Sigma, users can take action through:
Live connection to the cloud data warehouse
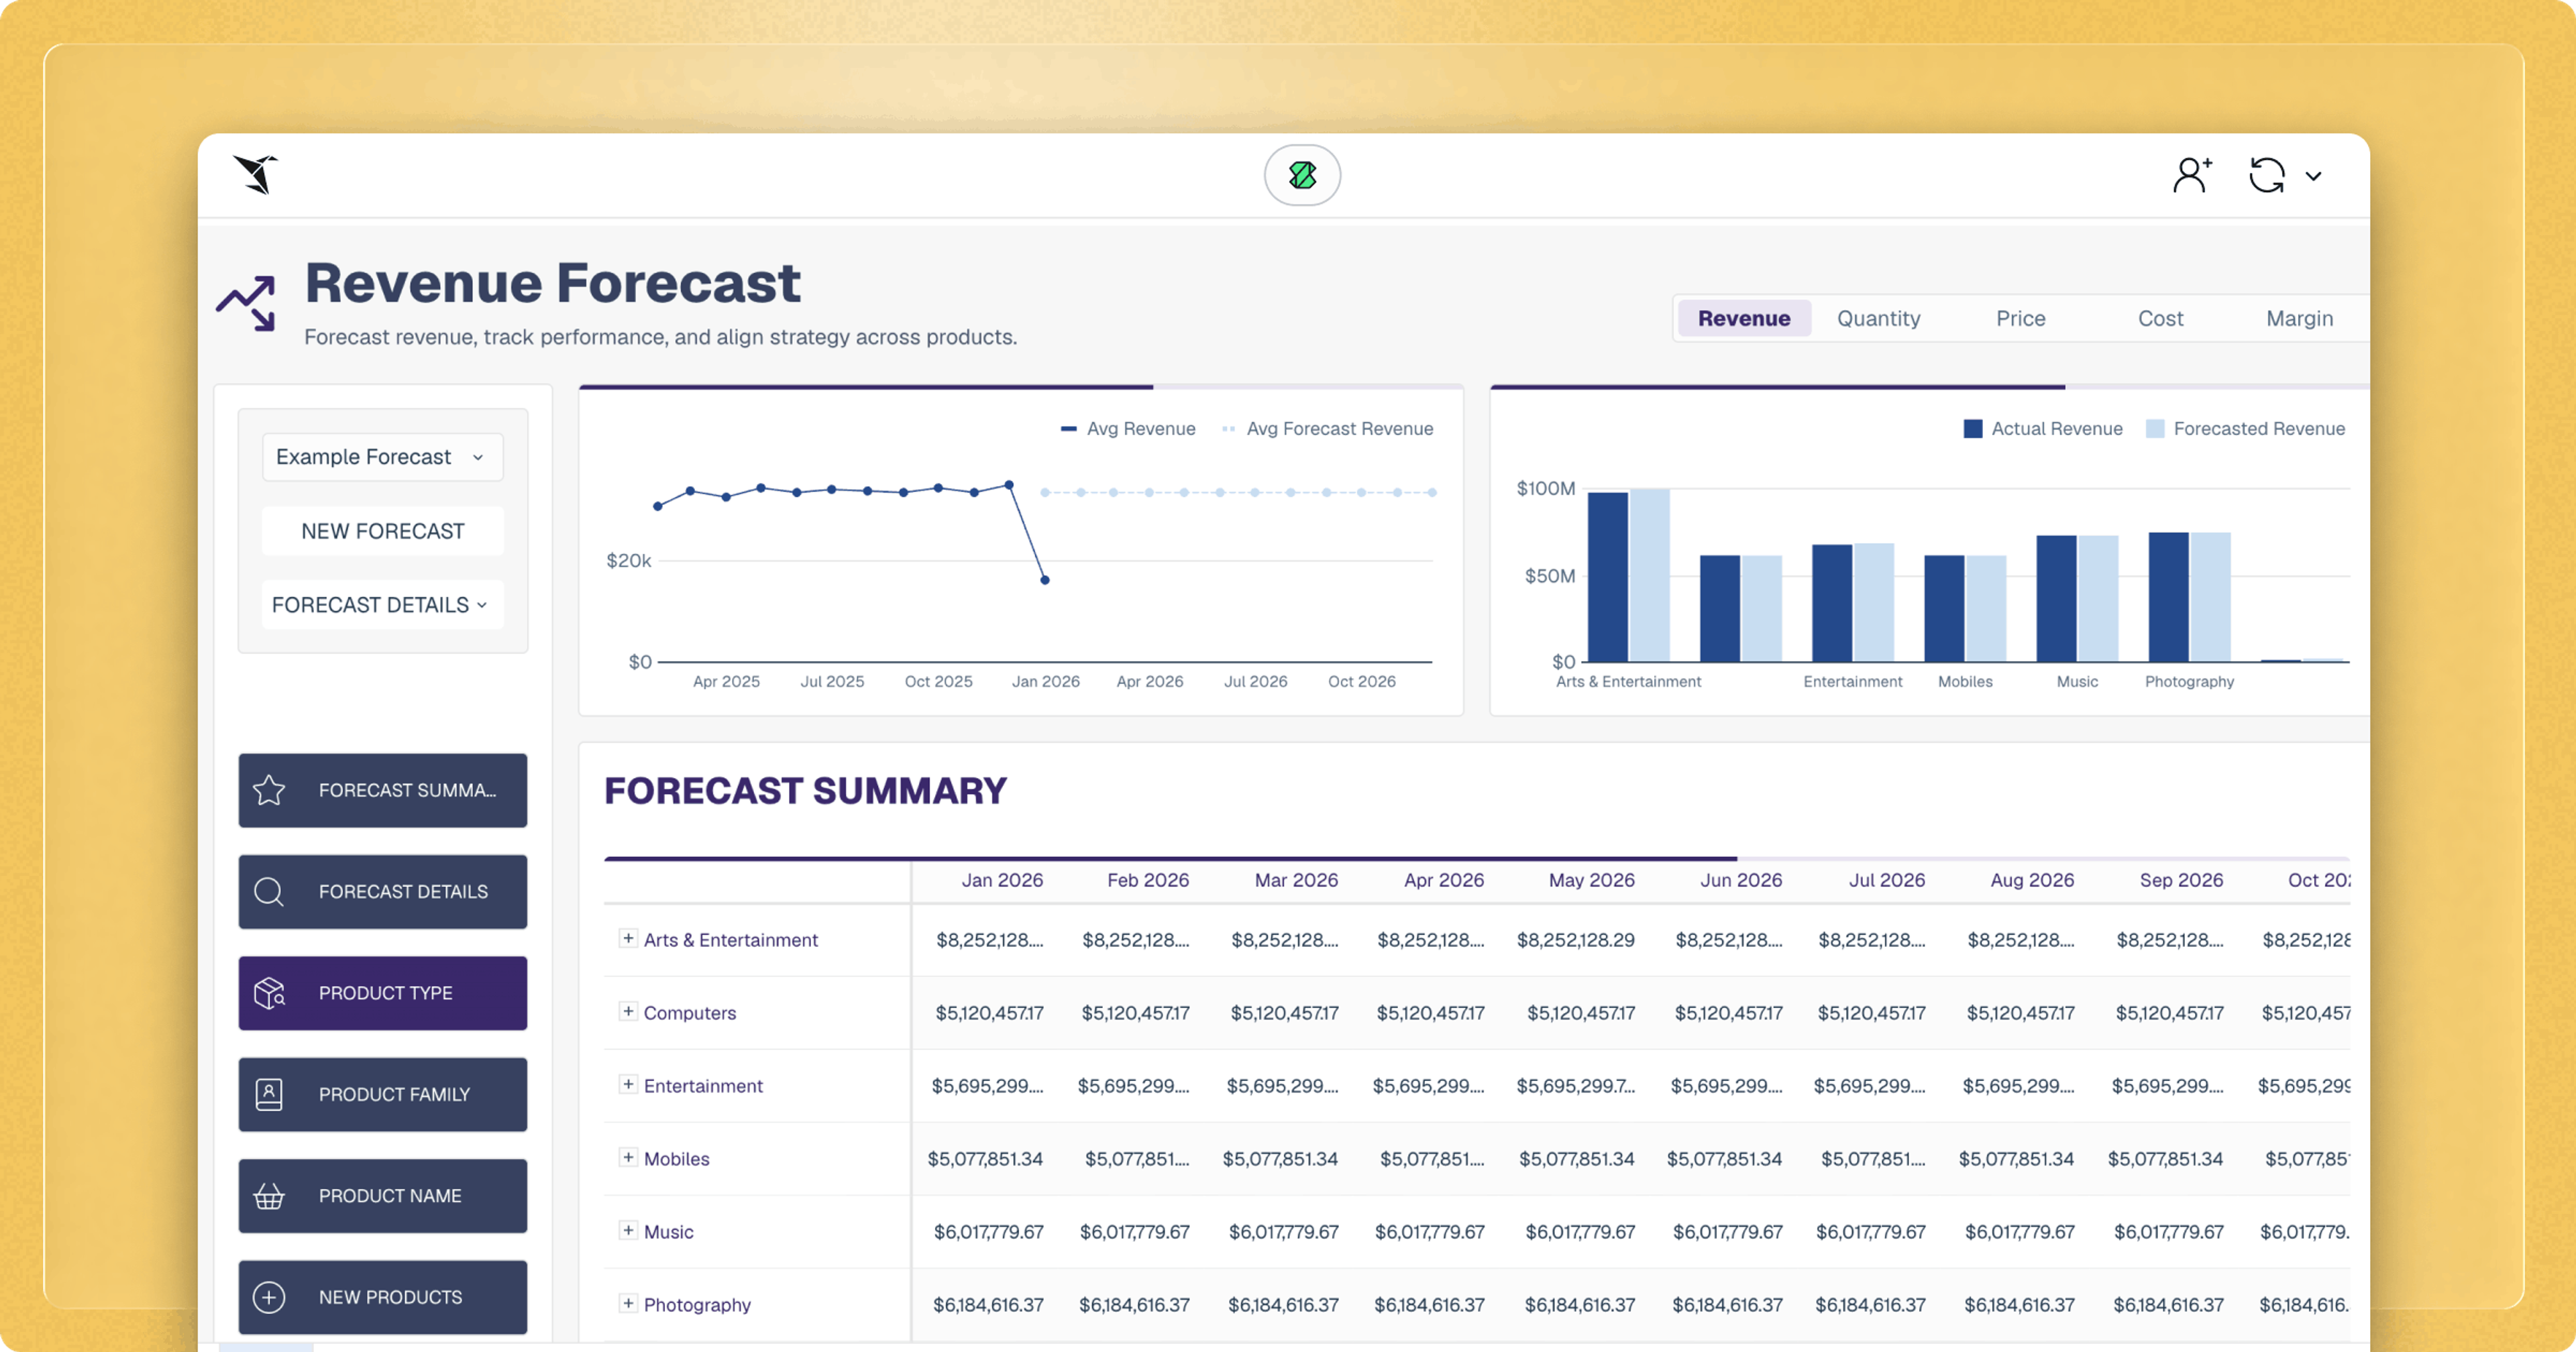
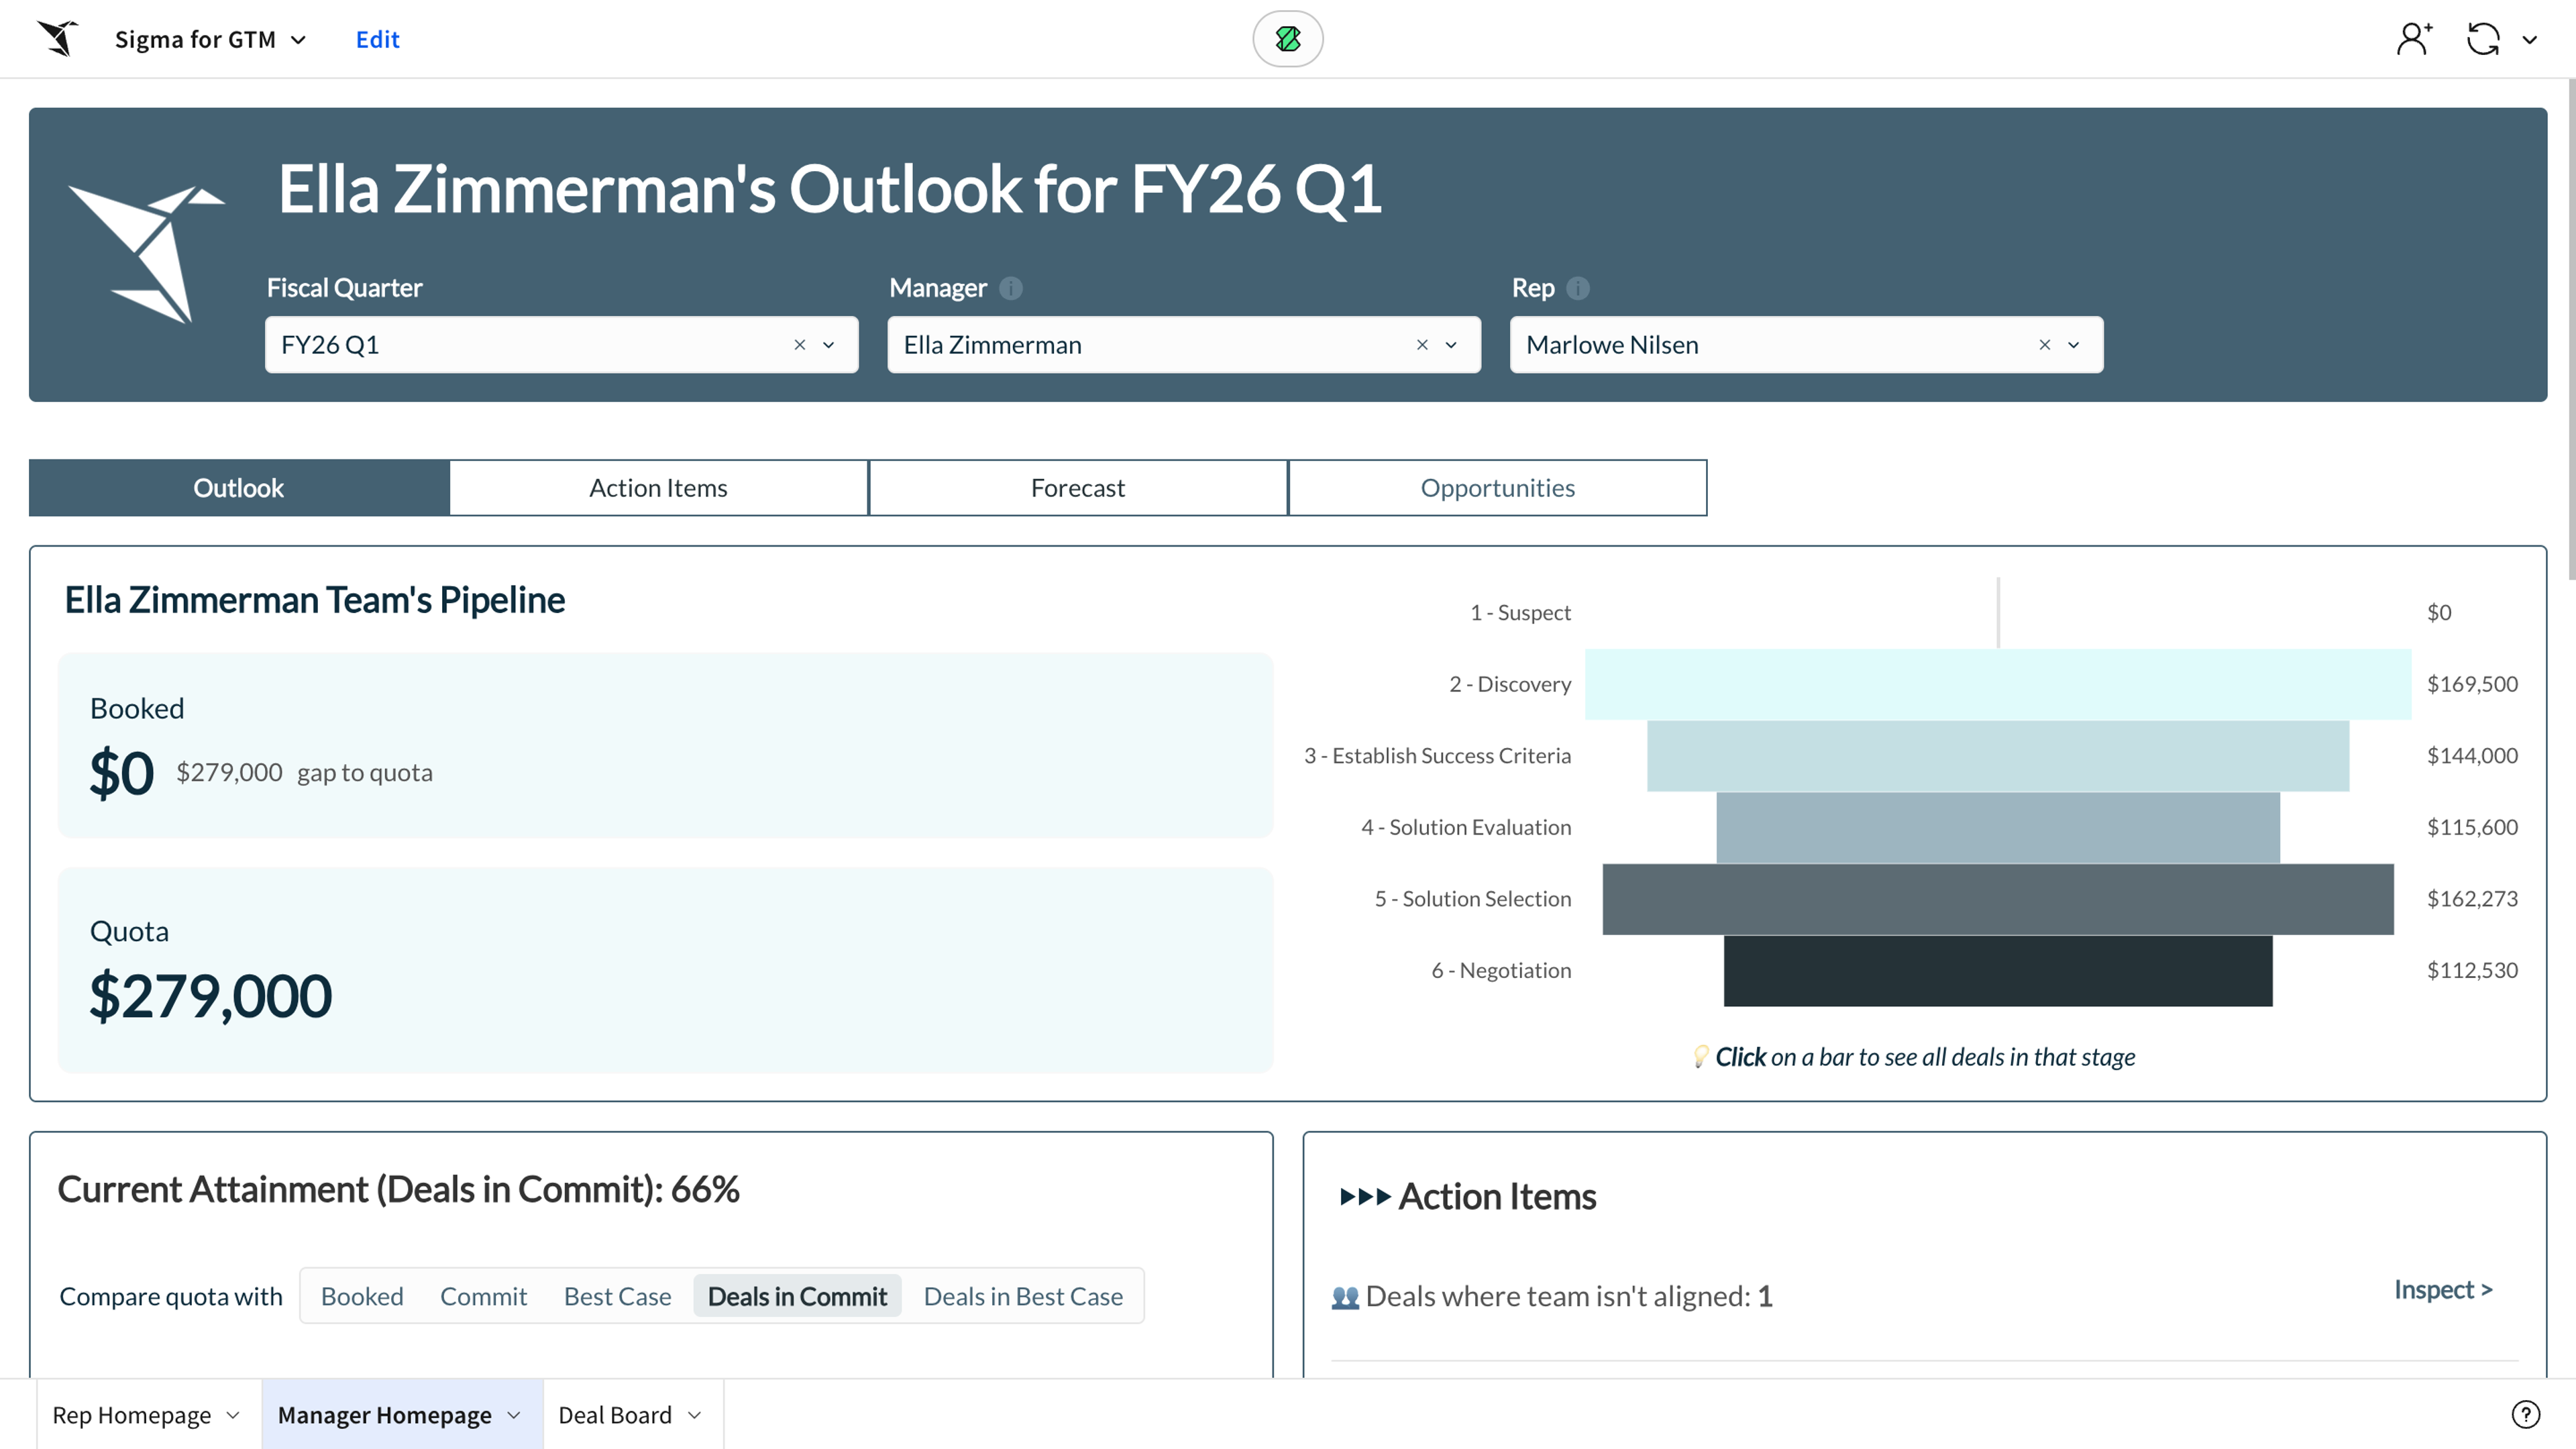
When a finance team hits Excel’s 1 million–row limit, they end up filtering, downloading subsets, and losing the full picture. Sigma’s live connection to your warehouse removes that friction, keeping data current, refreshing it automatically, and scaling to any volume. Take Sigma’s Pipeline Forecasting AI app. Sales teams track, adjust, and forecast in real time, pulling live data from their CRM and warehouse. As deal stages or probabilities change, the numbers update instantly.
Governed metrics
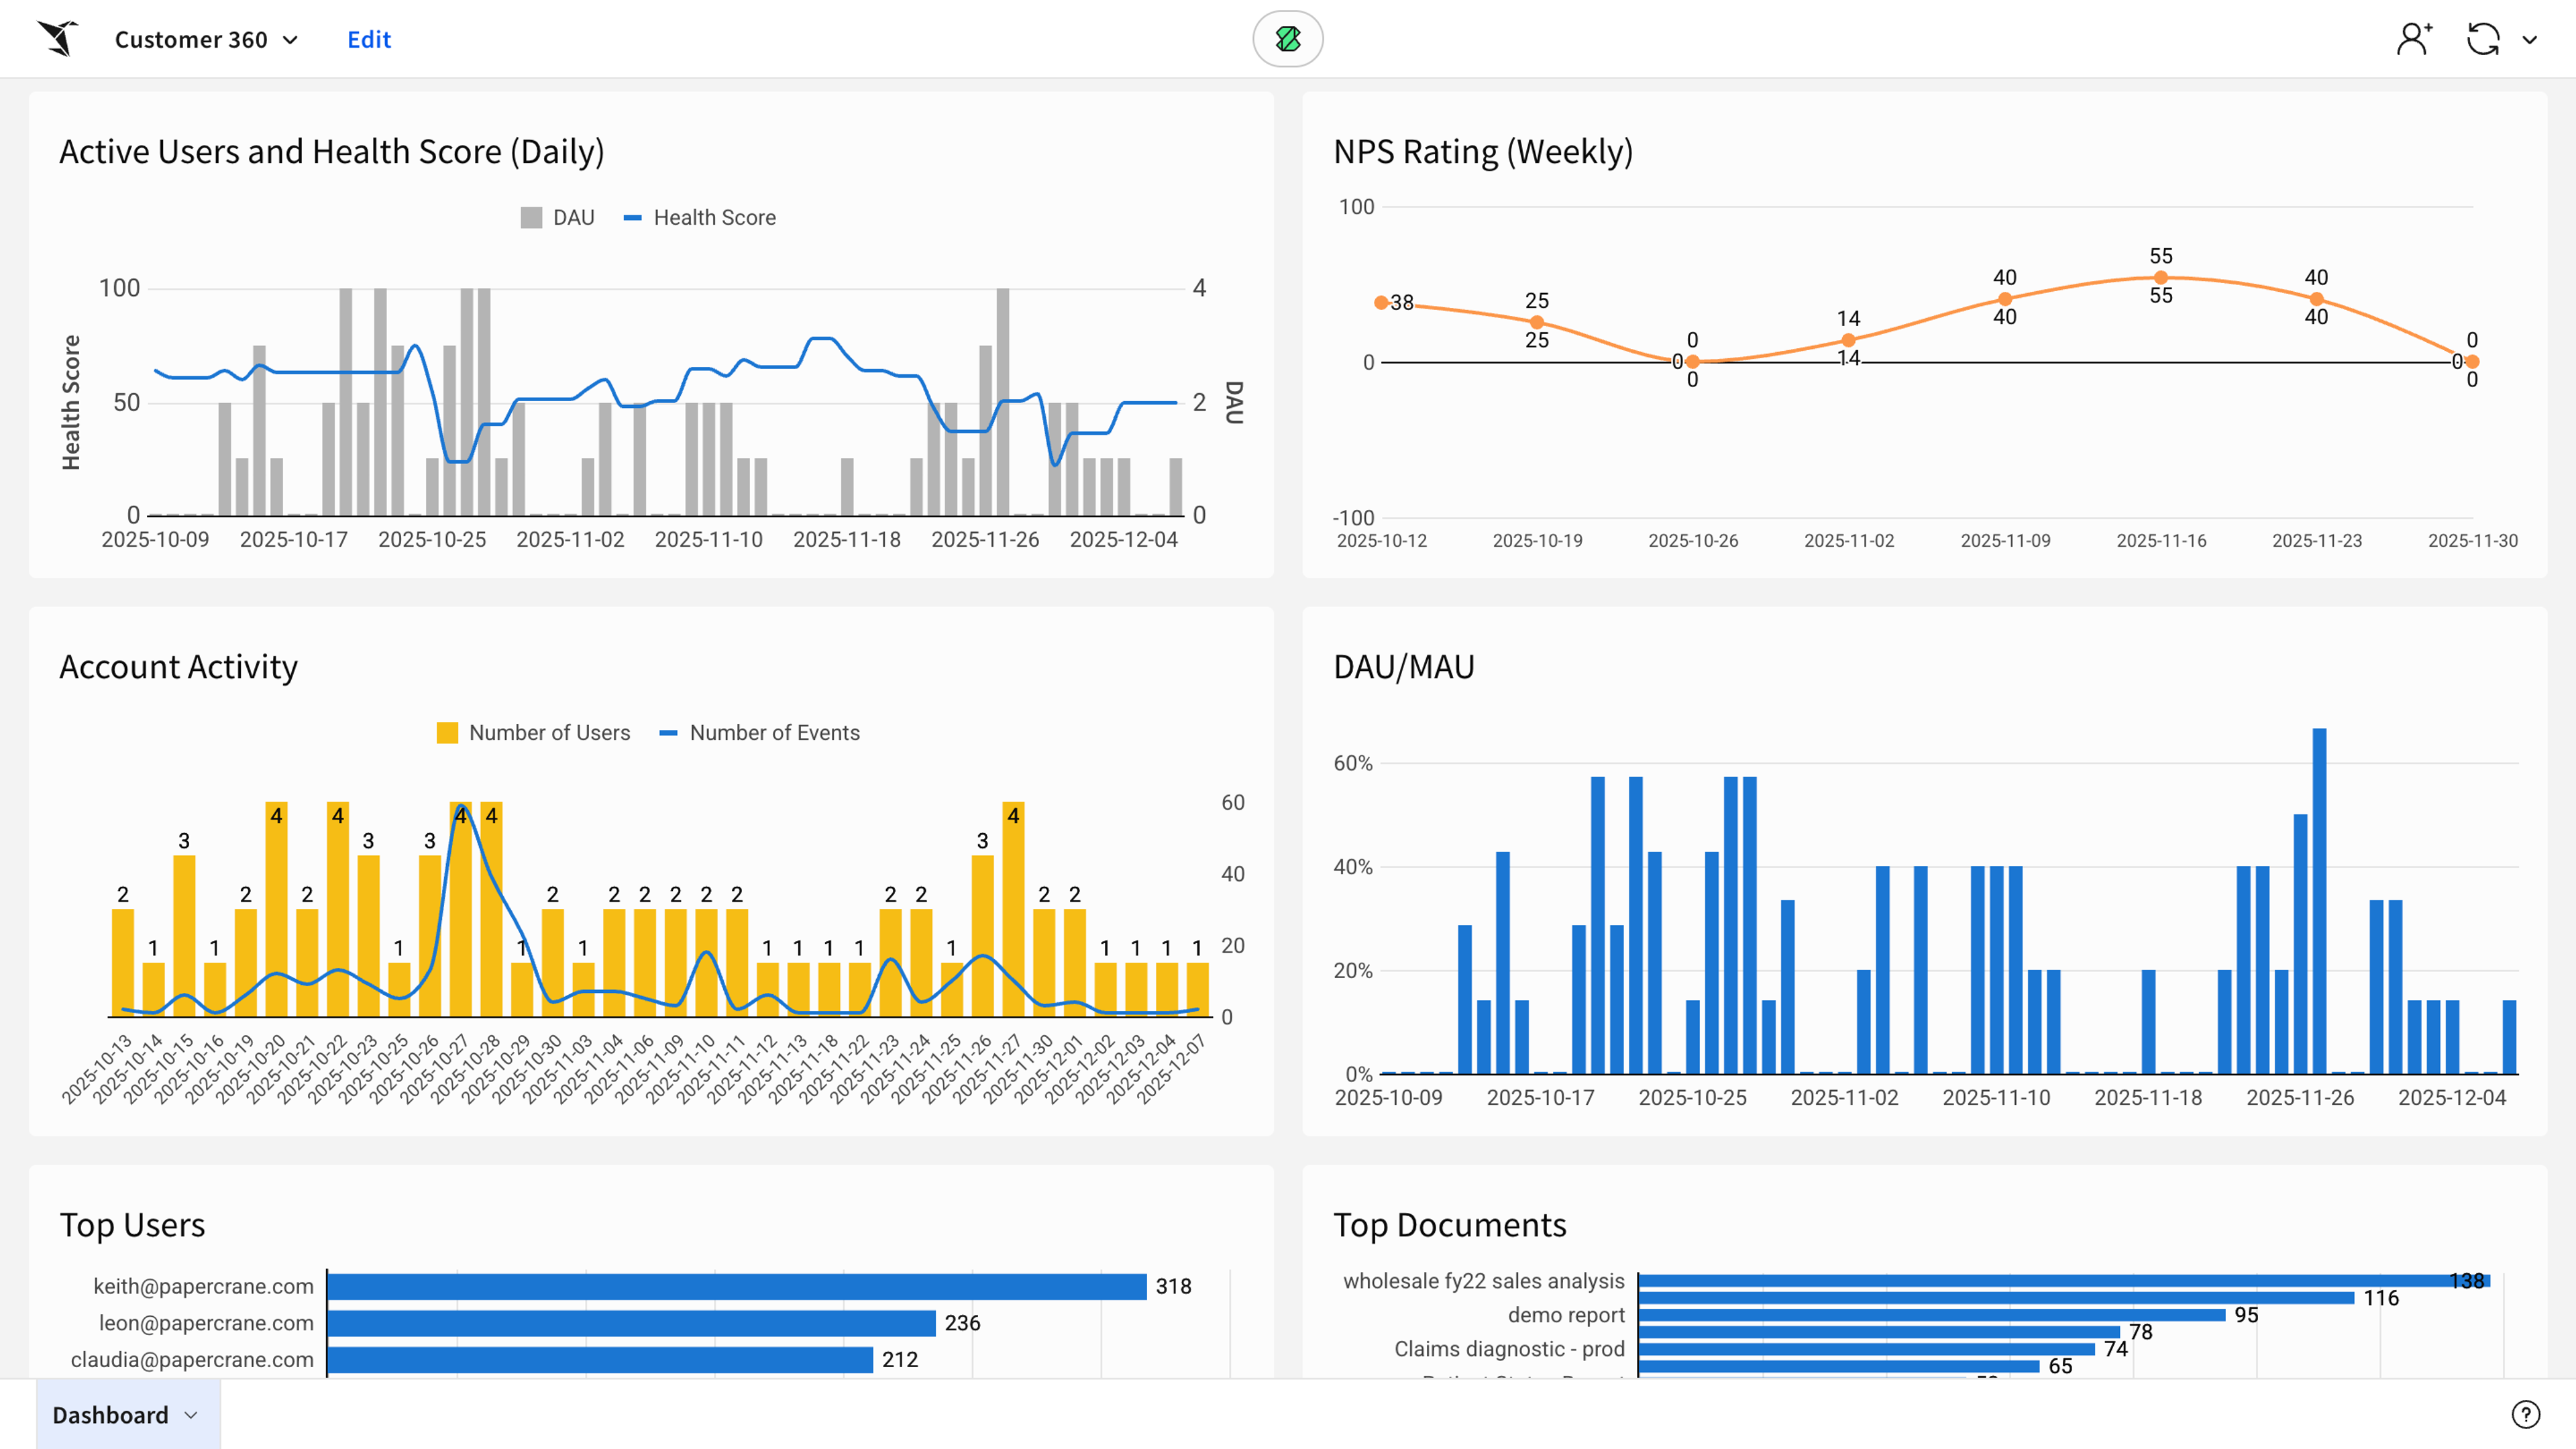
Traditionally, if you ask three teams for “revenue,” you’ll likely get three answers. Sigma’s governed metrics create one shared definition everyone reuses. With the Customer 360 Embedded AI app, retail teams use governed metrics to standardize key definitions like “active user” or “health score.” Because every team references the same governed metric, reports stay consistent and decisions stay confident.
Data models for reusable transformations
Much of spreadsheet work is repetition—rebuilding the same calculations over and over. Sigma’s data models let you define that logic once, like gross margin or sales velocity, and reuse it anywhere. The Customer 360 Embedded AI app puts that into practice. Analysts built reusable transformations for product-level forecasts directly in Sigma’s data model. Those definitions cascade across every report automatically, keeping insights accurate and analysts focused on analysis instead of maintenance.
Input Tables for judgment and collaboration
Spreadsheets make it easy to capture human input—but those updates live in isolation. Sigma’s Input Tables keep that context connected to live data. You can add assumptions, collect field inputs, and write back to your warehouse, all within the same workflow. That’s how AI apps like Pipeline Forecasting operate. Sales managers adjust forecasts right in Sigma, and those updates flow instantly through the data model. Collaboration happens in real time, with everyone working from the same, live source of truth.
Start making decisions in real-time with Sigma
When data finally flows the way it should, you can stop wrangling it and start doing something with it. Instead of just looking at dashboards, you can build AI apps that let people make decisions, take action directly, and respond to what the business needs in real time. This turns data into a tool you can use to run your business.
And this is where Sigma’s future starts to take shape. Apps unlock action, and AI adds intelligence on top of that action. Together, they move analytics from passive reporting to active decision-making—so data not only tells you what happened but helps you decide what to do next.
See how Sigma makes your data as easy to work with as a spreadsheet—schedule a demo or try Sigma today.