Sigma Training Videos
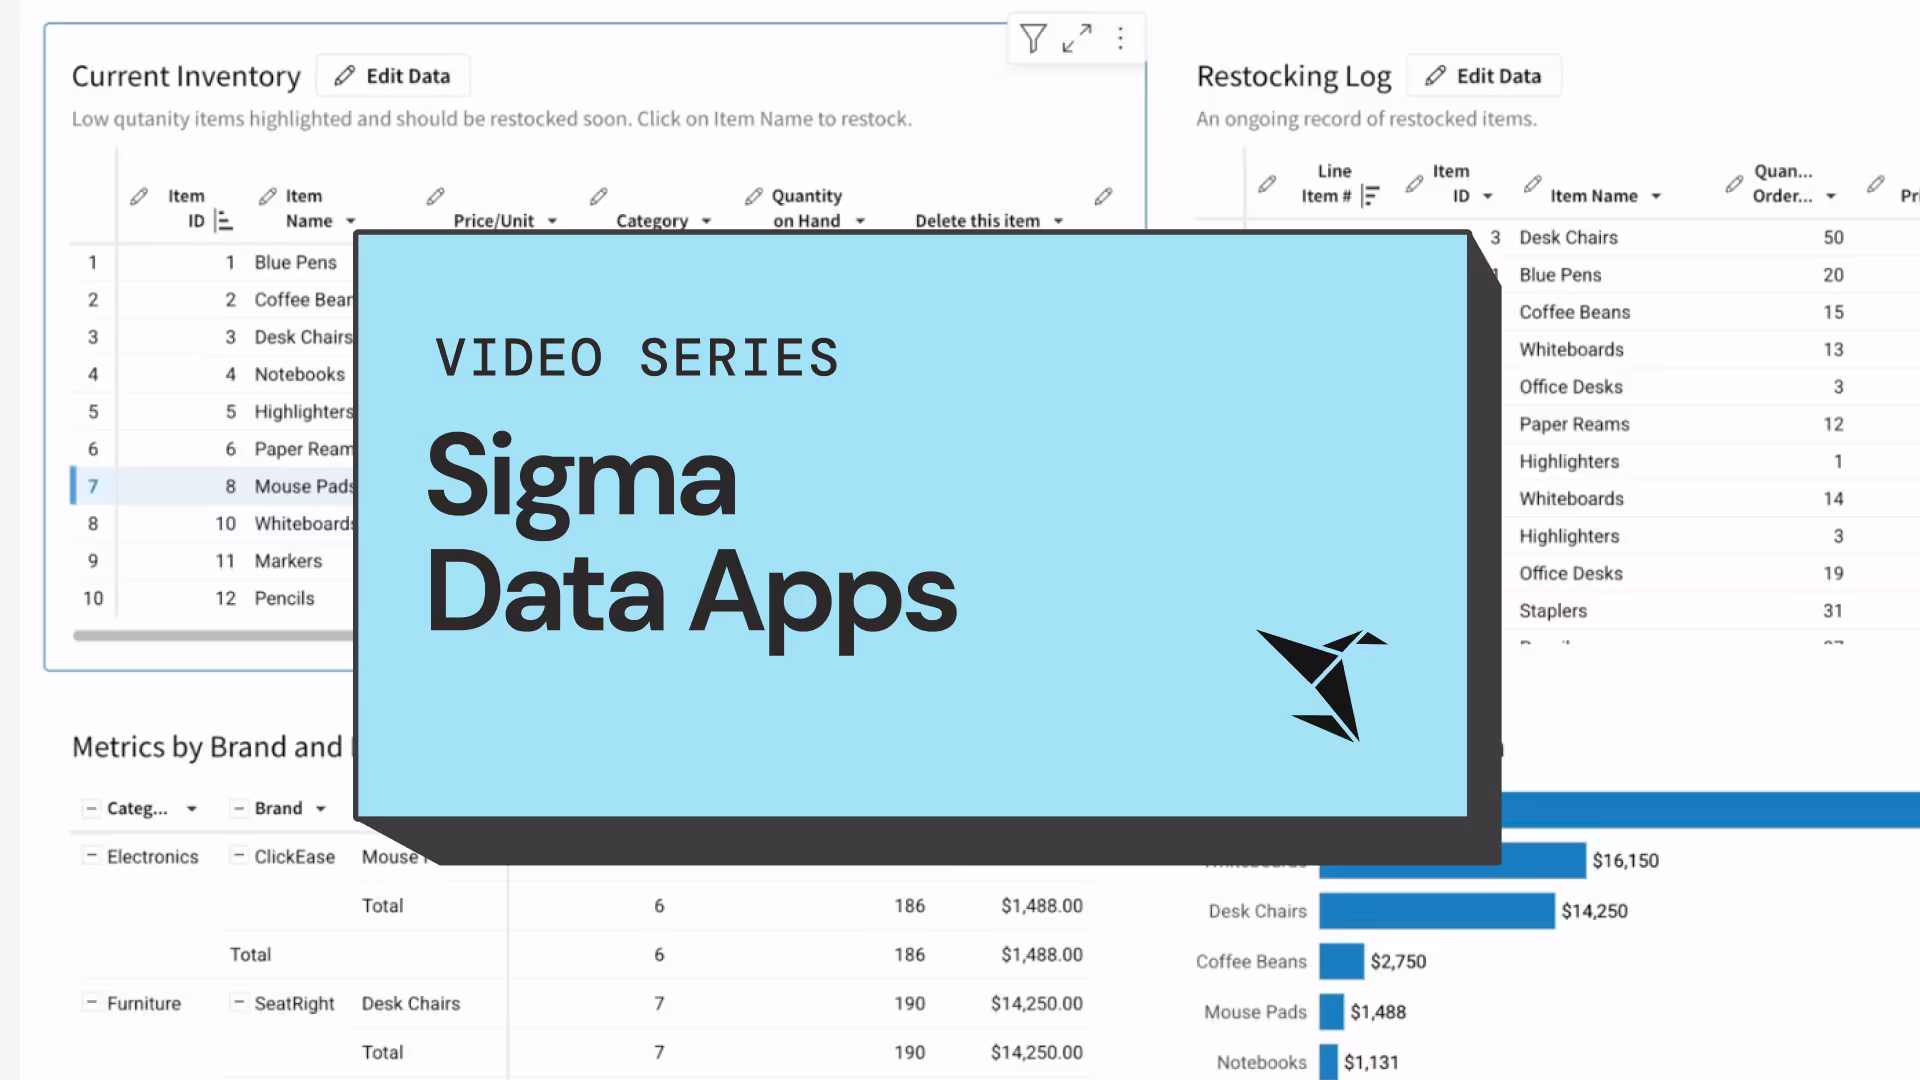
Sigma Data Apps
Getting started with Data Apps
Unify planning inputs like budgets vs. actuals, forecasts, and commentary. Execute agile, more frequent planning cycles.
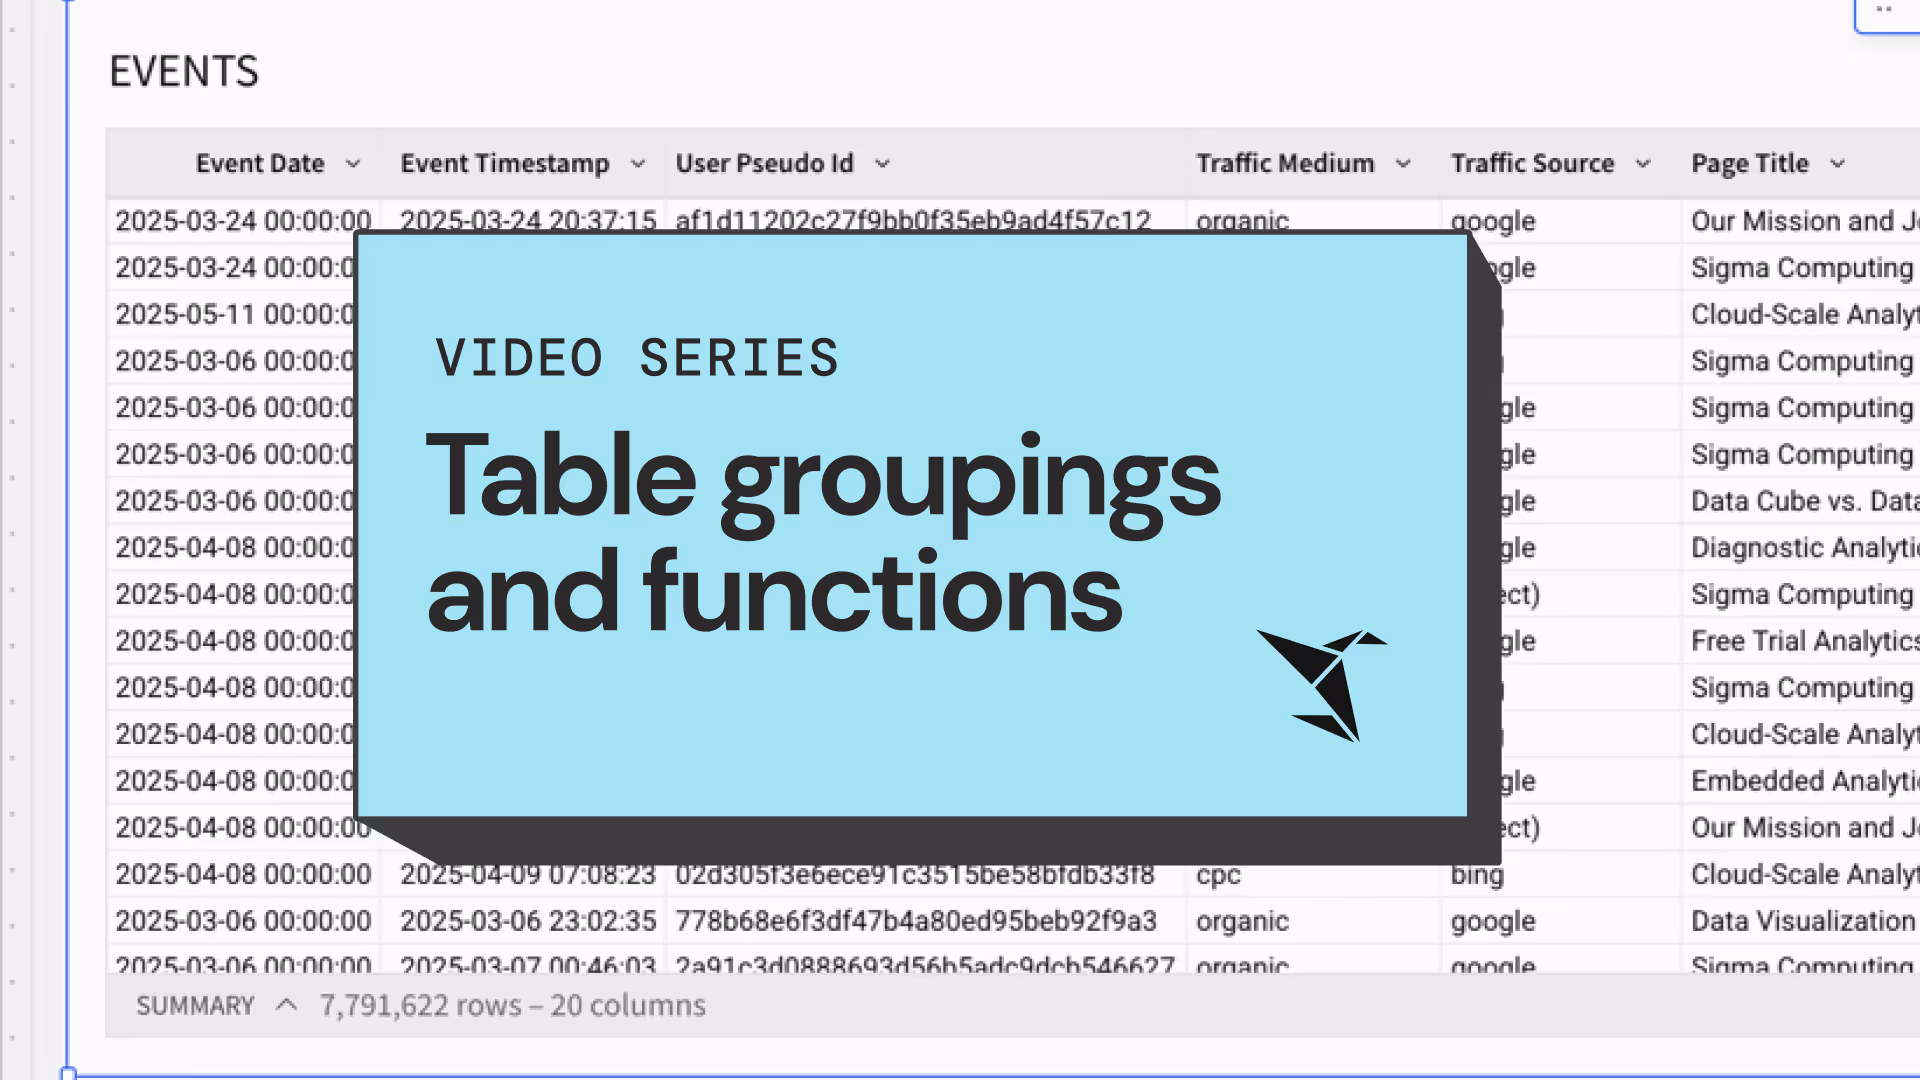
Table groupings and functions
Getting started with table groupings and functions
Short tutorial videos about using aggregate and window functions with table groupings (similar to group by in SQL) to perform powerful data analysis.
Ready to build your own Data App?
Start your free trial and put these skills into practice.